Using Amplitude in a VueJS A/B Testing Scenario


When it comes to releasing new features or changes in software, we can rely on A/B testing for making informed decisions. In this type of testing, we can measure the impact of the new change or feature on users before deciding to deploy it. By doing so, we can carefully roll out updates without negatively impacting user experience.
Introduction
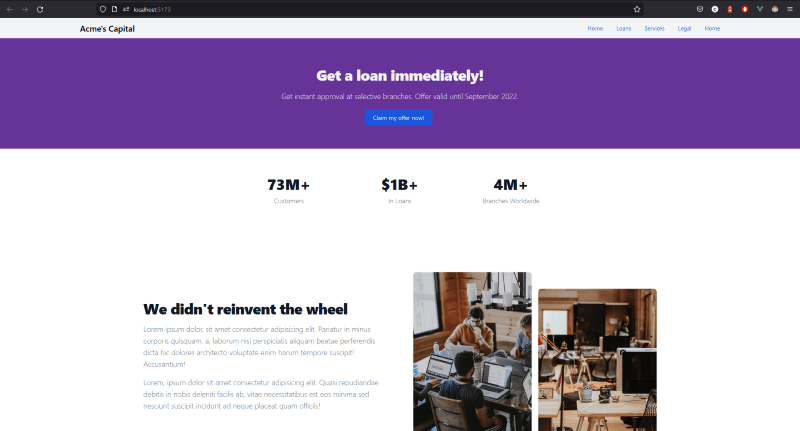
A/B testing can be applied to many software applications, including Vue. Let's use it to determine if the "Get a loan immediately!" call to action text can influence more loan sign-ups compared to the previous "Need a loan?" CTA text.
Feel free to reference the sample app for the full solution.
Here's a look at what the app looks like so far:
Setting up Amplitude
Without a tool for collecting and comparing test results, it is almost impossible to make an informed decision. For this, we're going to use Amplitude, but you can also use similar tools like Datadog.
1. Sign up for a free Amplitude account.
2. Switch to the Data section by clicking the dropdown at the top left.
3. Click the Sources link under Connections in the left sidebar, then click the + Add Source button on the top right to create a source.
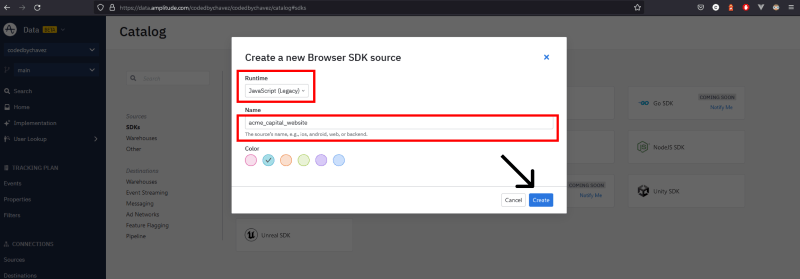
4. Select the Browser SDK from the SDK sources list and enter the following details to create a source.
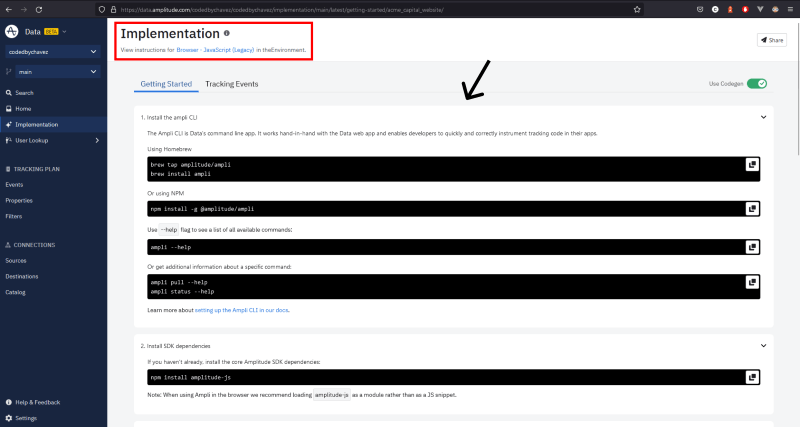
5. You should be automatically redirected to the implementation page as shown below. We'll follow these instructions after adding an event.
Adding an event
1. Click the Events link in the left sidebar under Tracking Plan to access the events page.
2. Click the + Add Event button at the top right to create an event and fill in the following details:
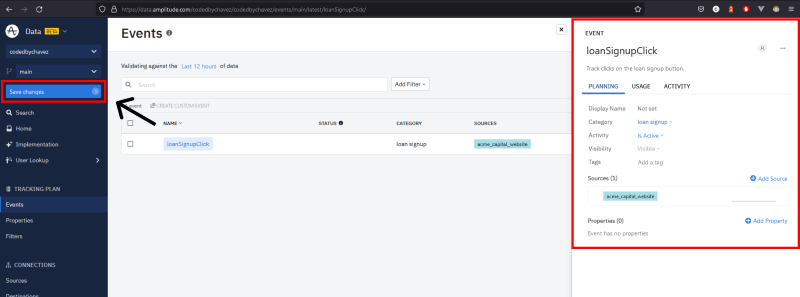
3. Click the Save changes button on the left sidebar.
Let's integrate Amplitude into our Vue application to log the event we created above.
Integrating Amplitude with Vue
Click the Implementation link in the left sidebar to see the integration instructions page.
1. Install the Ampli CLI with the following command:
npm install -g @amplitude/ampli
2. Install the amplitude JavaScript SDK dependencies:
npm install amplitude-js
3. Run the following command to pull the SDK into Vue:
ampli pull
Using this command, Amplitude will download all the necessary settings and configurations into our Vue application, including those added in the previous steps.
Sending an event
When it comes to Amplitude, there are two terms to be aware of. Source (where the data comes from) and destination (where the data goes). We are using Vue as the source and Amplitude as the destination in this example. The user can trigger the event we created earlier when they click the button under the CTA text:
1. Import and initialize amplitude in the banner component:
<script>

// Import the amplitude configuration in this component.
import { ampli } from '../../ampli';

export default {
  setup() {
    // Initialize amplitude with the production environment as stated on the integration page.
    ampli.load({ environment: 'production' });
  },
}

</script>
2. Create a method that triggers and sends the event when the button under the CTA text is clicked.
export default {
  // ... code omitted for clarity
  methods: {
    handleLoanSignupClick() {
      // Log the event to amplitude when the loan signup button is clicked
      ampli.loanSignupClick();
    },
  },
};
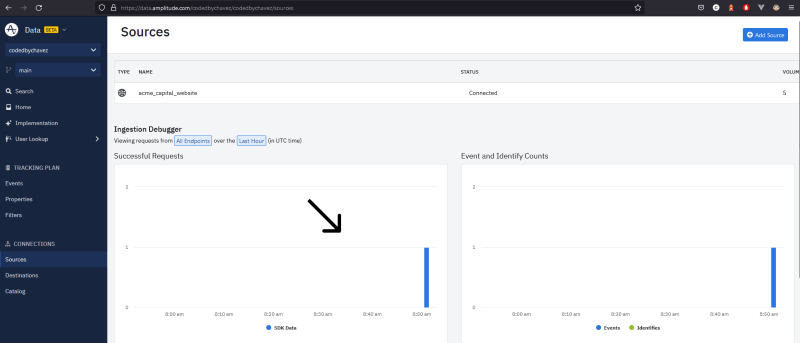
Checking for successful requests
1. Under Connections in the left sidebar, click on Sources.
2. Clicking on the Claim my offer now! button under the CTA text in the banner will log the event to amplitude as shown in the Successful Requests graph on the left:
Tracking the event on an analysis chart
Tracking successful requests is useful for debugging purposes only. To analyze the events, we want them to be displayed as a chart. Let's do that.
1. Switch to the Analytics dashboard, by clicking the dropdown arrow on the top left next to Data.
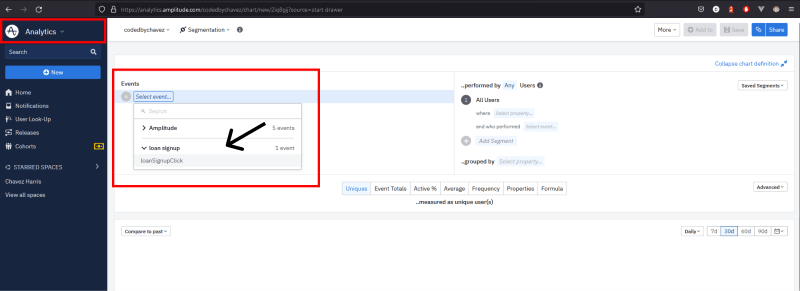
2. In the analytics dashboard, click the New button in the left sidebar.
3. Select Chart then select the event we created earlier:
Analyzing test results
You can compare which CTA text influenced the most loan sign-up clicks by clicking the Compare to past dropdown at the top of the analysis chart. As shown below, you can compare the results to a previous period:
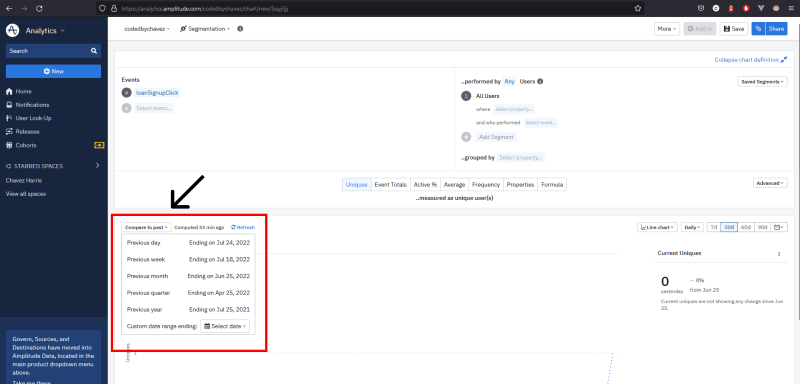
Based on the results here, you can make an informed decision moving forward on whether to keep or revert the new change or feature.
Final words
 Most often, A/B tests are complemented by feature flags since they can be used to manage new changes or features.
A 10-minute trainable feature flag management interface, such as ConfigCat's, simplifies the process even further. In the dashboard, we can turn features on or off for different user segments without changing code or redeploying the application when performing tests. As a bonus tip, you can also keep track of how often your feature flags are changed during testing by connecting your ConfigCat account to Amplitude. I highly recommend you give this a try with a free account.
Most often, A/B tests are complemented by feature flags since they can be used to manage new changes or features.
A 10-minute trainable feature flag management interface, such as ConfigCat's, simplifies the process even further. In the dashboard, we can turn features on or off for different user segments without changing code or redeploying the application when performing tests. As a bonus tip, you can also keep track of how often your feature flags are changed during testing by connecting your ConfigCat account to Amplitude. I highly recommend you give this a try with a free account.
There are also many other frameworks and languages that ConfigCat supports. The full list of supported SDKs is available here.
Get the latest updates from ConfigCat on Twitter, Facebook, LinkedIn, and GitHub.