A/B Testing and Visualization in Amplitude
This is a step-by-step guide on implementing an A/B testing scenario using ConfigCat and visualizing the results in a funnel with Amplitude. There is a working sample application on GitHub if you want to follow along.
What is A/B Testing?
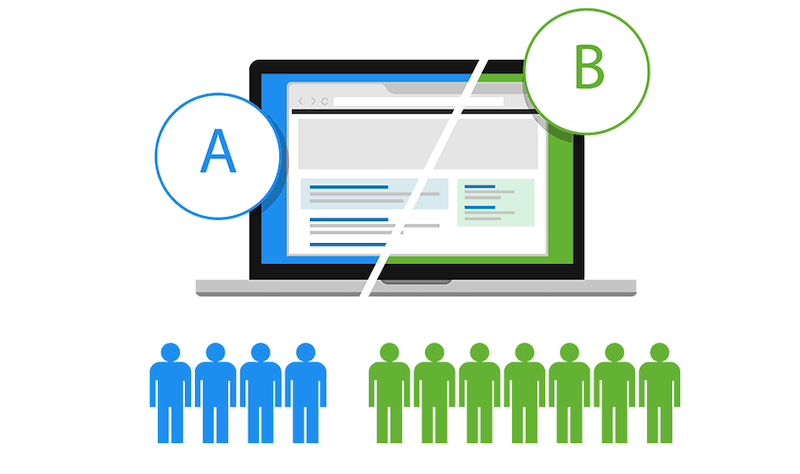
A/B testing (split testing, bucket testing) compares two versions of the same web page, app, or UI component to determine which one drives more conversions or performs better (has more clicks, registrations, purchases, etc.). It lets you show two versions of your idea to your visitors, from which they'd decide on a winner. 50% of visitors see version A of your page (called control), while the other 50% would be served version B (variant).
You'd then be able to measure the conversion rates of these versions in your analytics tool.
Conversion rate represents the percentage of visitors on your website that complete a desired goal (a conversion) out of the total number of visitors. A conversion can be any desired action you want them to take, usually signing up for a service or purchasing a product.
If the variant (version B) generated the highest conversion rate, you would then declare it the winner and show this version to 100% of visitors, effectively turning it into the new 'control' version.
Then, the variant becomes the new control, and you can design a new variant and test it again for even better results. With this method, you can improve your product based on actual, measured visitor data.
What is Amplitude?
Amplitude is a popular product analytics tool that helps to track your visitors and understand exactly how users interact with your product.
Here is the Amplitude Quick Start Guide.
Implementing the A/B test
You can follow along with the Angular sample application here.
The goal of the A/B test is to show the variant to 50% of visitors, and the control to the other 50%. Then measure the results.
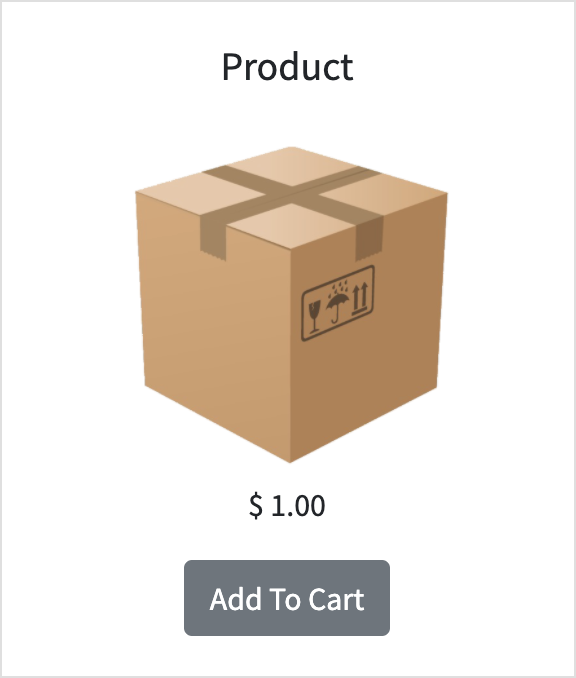
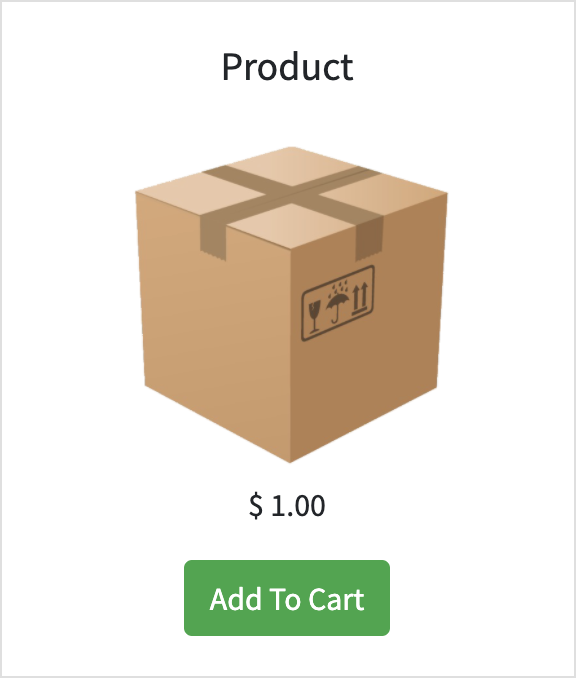
Create two different versions of the card. There should be a gray (control) and a green (variant) version.
Control | Variant |
|---|---|
 |  |
<div *ngIf="!isGreenButtonEnabled">
  <button class="button-gray" (click)="buttonClicked()">Add To Cart</button>
</div>
<div *ngIf="isGreenButtonEnabled">
  <button class="button-green" (click)="buttonClicked()">Add To Cart</button>
</div>
The isGreenButtonEnabled variable holds the value of the feature flag that comes from the ConfigCat SDK. More details on that later.
Split the visitors in 50-50 groups
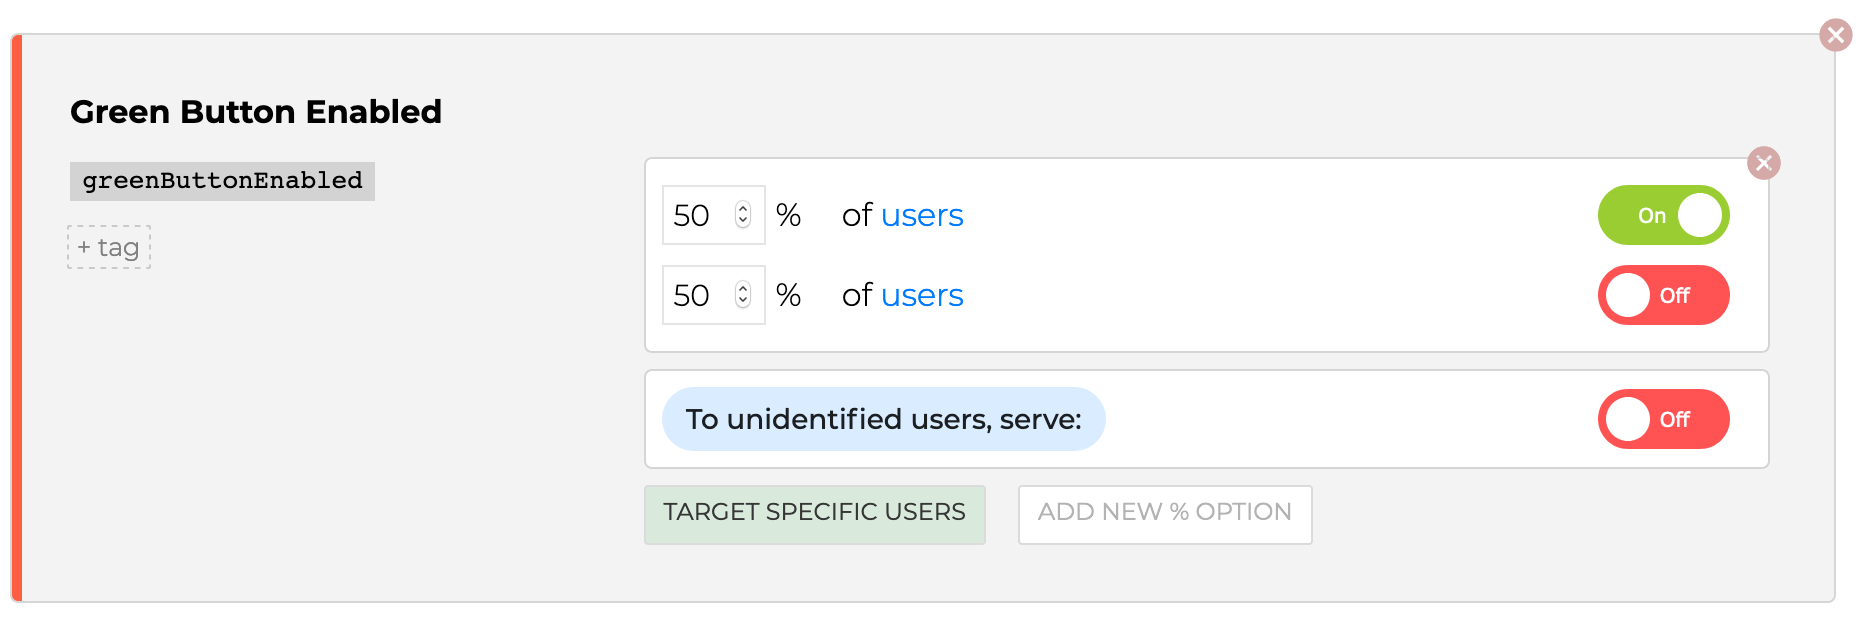
First, create a new Green Button Enabled feature flag on the ConfigCat Dashboard.
Then use the TARGET % OF USERS feature to add a percentage-based targeting rule and set it to 50%.
Get the feature flag value from ConfigCat
The ConfigCat SDK downloads the feature flag from ConfigCat and evaluates it's value based on the user's unique identifier. When the greenButtonEnabled feature flag is evaluated, it will return true in 50% of the cases.
A
userObjectwith at least a unique identifier is required to split the users into two groups. More about the UserObject here.
let configCatClient = configcat.createClient('###YOUR-CONFIGCAT-SDK-KEY###');

let userObject = { identifier: '##SOME-USER-IDENTIFIER##' };

configCatClient
  .getValueAsync('greenButtonEnabled', false, userObject)
  .then((value) => {
    console.log('greenButtonEnabled: ' + value);
  });
In the sample application I used the Amplitude deviceID (amplitude.getInstance().options.deviceId) as the unique identifier.
Send the tracking data to Amplitude
To interact with Amplitude you can use the official amplitude-js SDK.
import amplitude from 'amplitude-js';
The button's click handler function sends button_clicked event to Amplitude:
buttonClicked() {
  amplitude.getInstance().logEvent('button_clicked');
}
Collect the feature flag evaluation results
In order to create a funnel diagram in Amplitude, you need to collect the key and value of every feature flag participating in the A/B test.
It is only the greenButtonEnabled feature flag now, but it is a good idea to have a general solution preparing for future A/B experiments.
ConfigCat provides the getAllValues() function to get all feature flag keys and values for the current user in one call.
configCatClient.getAllValuesAsync(userObject);
Update the Amplitude user identity and upload the data
Use Amplitude's Identify API to set the key and value pairs as user's properties.
And send a visited event to Amplitude to indicate that the user has visited the page.
ngOnInit() {
  amplitude.getInstance().init('AMPLITUDE_API_KEY');

  const userObject = new User(amplitude.getInstance().options.deviceId);

  this.configCatClient.getAllValuesAsync(userObject).then((values) => {

    const identity = new amplitude.Identify();
    values.forEach(i => { identity.set(i.settingKey, i.settingValue); });

    amplitude.getInstance().identify(identity);

    amplitude.getInstance().logEvent('visited', {'title': this.title});
  });
}
Funnel diagram to visualize the A/B test results
A funnel is a series of steps a user takes as part of the product's UX. In Amplitude, a Funnel Analysis displays users who performed a series of events that lead towards a predefined goal, which can then be used to calculate the conversion rates.
Amplitude considers a user to have converted through a step in the funnel if they fire the event in the specified order.
In our case:
visitedevent is fired when the user visits the page.button_clickedevent is fired when the user clicks theAdd To Cartbutton.
The goal here is to lead (or convert) our visitors through these events and measure the conversion rate of the button click.
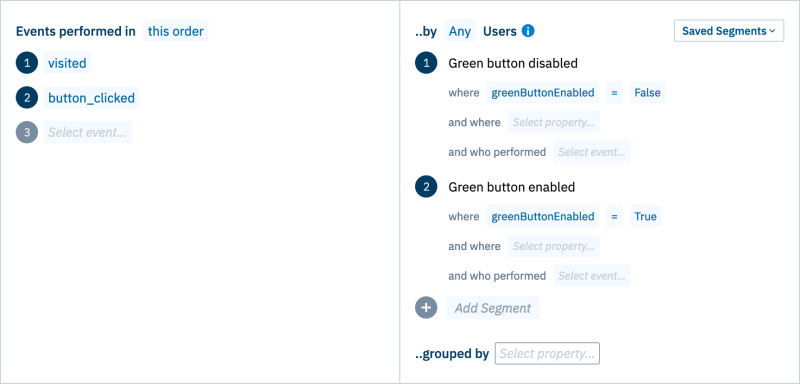
On the right side, the so-called User Segments are defined:
Green button disabled(control) where the uploadedgreenButtonEnableduser property isfalse.Green button enabled(variant) where user property istrue.
Analyzing the A/B test results
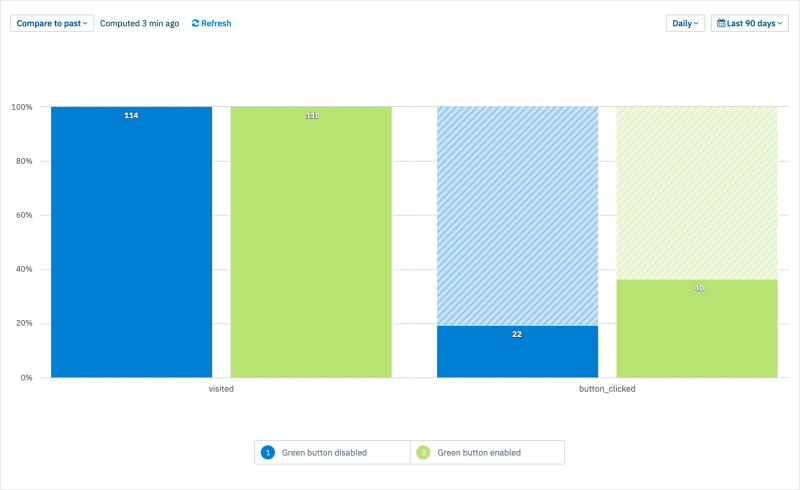
From the gathered data, we can extrapolate that in the Green button disabled case, only 22 (or 19.3%) from a total of 114 page visitors clicked on the gray button, while the conversion rate is nearly doubled for the Green button enabled case, with 40 (or 36.4%) of 110 visitors clicking the green button.
In this example, the green button converts better, meaning visitors prefer to click on the green button.
Once you have a winner, it is good to keep that solution and remove the greenButtonEnabled feature flag and the experimentation logic from the source code.
Key takeaways
- Plan your A/B testing experiment.
- Implement the different versions using feature flags.
- Collect evaluated feature flag values and visitor interactions.
- Visualize the funnel with Amplitude.
If you'd like to dig deeper, here are a few useful links:
- Sample App
- Amplitude
- ConfigCat Docs
- ConfigCat JavaScript SDK Docs
- ConfigCat JavaScript SDK on GitHub
Keep up with ConfigCat on X, Facebook, LinkedIn, and GitHub.

