How to Perform an A/B Test in Nuxt.js

Most software features are designed and tested in-house before making their way into the hands of users. While this is somewhat of a standard approach in feature deployments, it may cause user experience issues. This is because the majority of end users are not tech-savvy and aren't thinking the way engineers do.
Adopting an A/B testing approach prior to making a final feature deployment decision can prevent or lessen the risk of interfering and affecting user experience. Features can be tested and released to a subset of end users initially where the current metrics can be recorded and compared to a previous benchmark. As a result, developers may choose to improve or cancel the feature altogether without the risk of blindly affecting the entire user base.
You can simplify your A/B tests by using a hosted feature flag management service such as ConfigCat. Within the dashboard, you can create and manage feature flags that can be toggled on and off before and after testing. Let's put this all together in a demo A/B testing scenario.
Exploring an A/B test scenario
Performing an A/B test requires two primary components. Here is an analogy. You can think about these as two separate buckets.
The first bucket is called the control bucket. It is the state of the software or app without any new features or updates. The second bucket is called the variation bucket. It is the combination of the control state of the software or app plus any new features or updates to test.
Prior to testing, we must first identify these buckets. For this, I've created a sample app to demo how we can do so. Here's a snapshot of it:
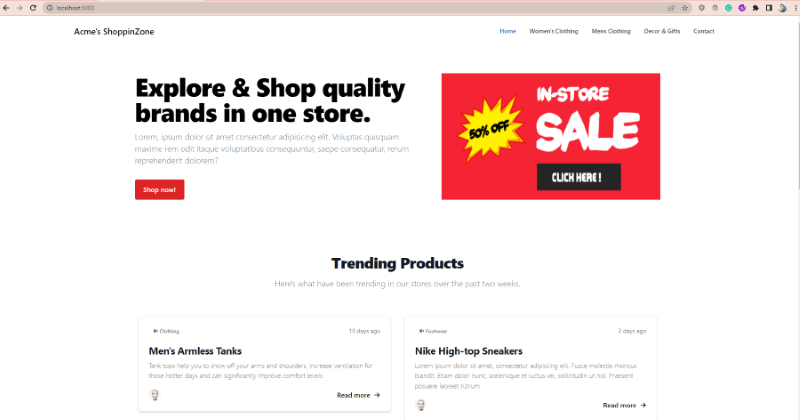
Notice the red sale banner on the right? Let's mark the current state of the site we see as our variation bucket. It includes a red sale banner. The previous state of the website had the same banner but it was colored yellow. This can be marked as our control bucket.
By laying these out this way, we can deploy the two states of the website (control and variation) to see if the red sale banner influence more users to visit the store page.
To perform a comparison between the control and variation states, let's look at the benchmark for the control state:
Current number of clicks (The control state - with yellow banner):
Store page - 200 visits per day.
Number of clicks (The variation state - with red banner):
Store page - Number of visits to be determined by the A/B test.
Finding a balance
To prevent biases, and yield higher quality results we have to properly segment a fixed percentage of users to test on. This can be done with the help of a feature flag (See the next section). I've used it to serve the red banner bucket to only a subset of users rather than the entire user base.
By toggling the feature flag on or off, we can easily switch between the two buckets (variation and control respectively) at anytime without editing or redeploying our code.
Adding a feature flag
-
Create a free ConfigCat account.
-
In the dashboard, create a feature flag with the following details:
Name: canShowRedSaleBanner
Key: canshowredsalebanner
Description: Toggles the red sale banner
*Be sure to turn on the feature flag in your appropriate environment.
-
Click the ADD FEATURE FLAG button to create and save the feature flag.
-
Set up the user segment to test on in the dashboard.
-
Toggle the feature flag on, then integrate the feature flag into your Nuxt application
To track and collect the click events, you can use the same tool that you used to collect the control state/benchmark metrics. I'll be using a product analytics tool called Amplitude to do this. In a later step, we'll look at how we can compare the difference in clicks influenced by the red sale banner.
Setting up Amplitude
1. Sign up for a free Amplitude account.
2. Switch to the Data section by clicking the dropdown at the top left.
3. Click the Sources link under Connections in the left sidebar, then click the + Add Source button on the top right.
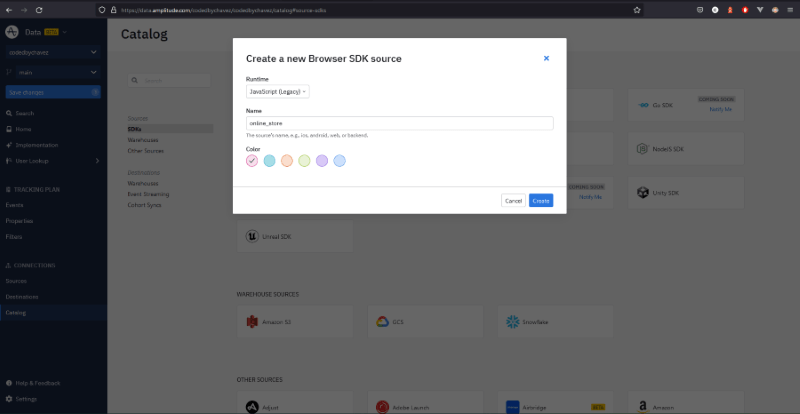
4. Select the Browser SDK from the SDK sources list and enter the following details to create a source:
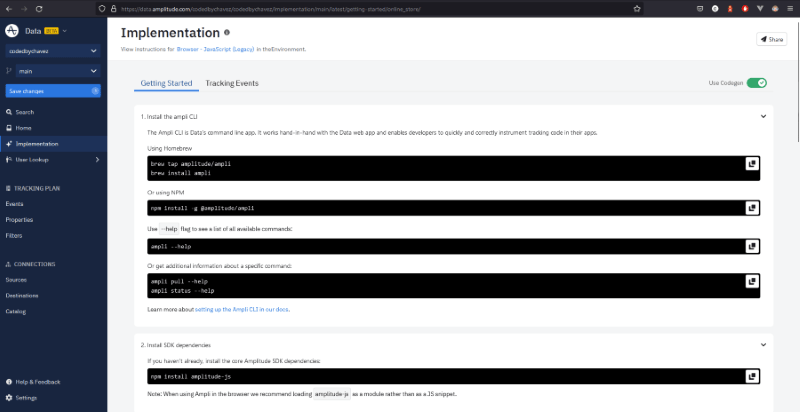
5. You should be automatically redirected to the implementation page as shown below. We'll follow these instructions soon but first, let's add an event.
Adding an event
-
Click the Events link in the left sidebar under Tracking Plan to access the events page.
-
Click the + Add Event button at the top right to create an event and fill in the following details:
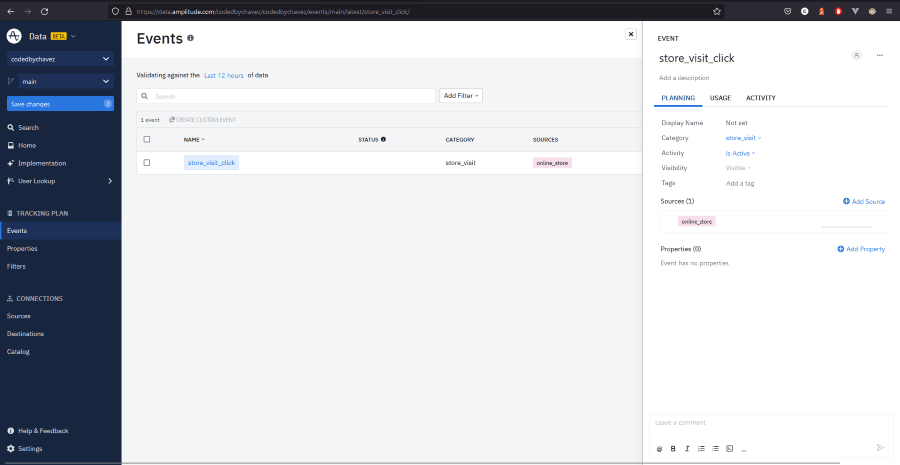
- Click the Save changes button in the left sidebar.
Integrating with Amplitude
Click the Implementation link in the left sidebar to see the integration instructions page.
- Install the amplitude CLI with the following command:
sh npm install -g @amplitude/ampli
- Install the amplitude JavaScript SDK dependencies:
npm install amplitude-js
- Run the following command to pull the SDK into Nuxt:
ampli pull
Using this command, Amplitude will download all the necessary settings and configurations into our Vue application, including those added in the previous steps.
Sending an event from Nuxt
Let's look at how we can trigger and send the event we created above from the Nuxt app.
1. Import and initialize amplitude in the component:
<script>
// Import amplitude configuration
import { ampli } from '../../../src/ampli';

export default {
    mounted() {
        // Initialize amplitude with the production environment as stated on the integration page.
        ampli.load({ environment: 'production' });
    },
}
</script>
2. Create a method that triggers and sends an event when clicking the sale banner.
export default {
  // ... code omitted for clarity
  methods: {
    handleSaleBannerClick() {
      // Log the event to amplitude when the banner is clicked
      ampli.storeVisitClick();
    },
  },
};
To verify that Nuxt is connected to our Amplitude account, let's check for logged requests.
Checking for logged requests
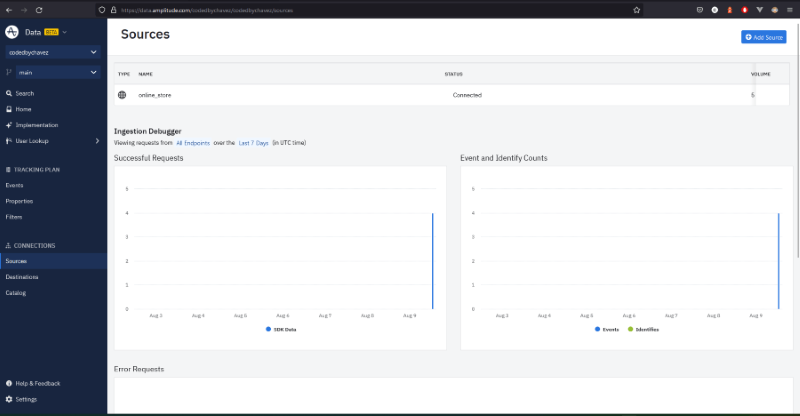
1. Under Connections in the left sidebar, click on Sources.
2. Clicking on the sale banner will log the event to amplitude as shown in the Successful Requests graph on the left:
Recap
Before moving forward, let's take a moment to recap what we did up to this point:
1. We discussed the concepts of the control and variation states (buckets) and identified them in our app.
2. Created a feature flag.
3. Set up an Amplitude account.
4. Created a source.
5. Added an event.
6. Pulled the amplitude configs and integrated them into Nuxt.
7. Sent and tracked a few successful requests from Nuxt.
Let's now take a look at creating an analysis chart for collecting the click events metrics.
Setting up an analysis chart
1. Switch to the Analytics dashboard, by clicking the dropdown arrow on the top left next to Data.
2. In the analytics dashboard, click the New button in the left sidebar.
3. Select Analysis, then select Segmentation.
4. Select the event as shown below:
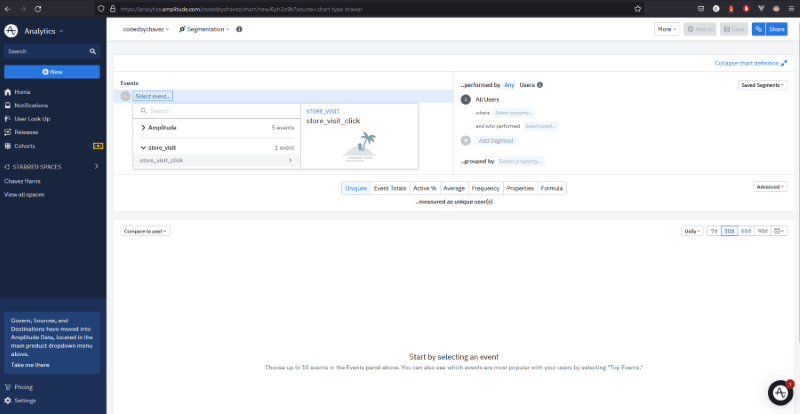
5. Click Save on the top right to save the chart.
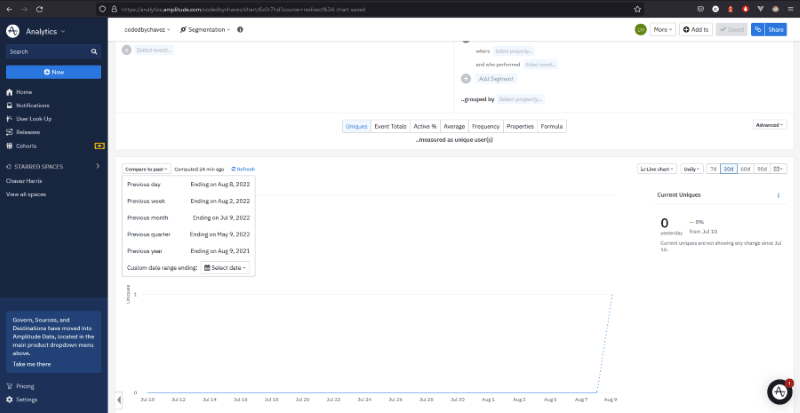
Analyze the test results
To compare and analyze the results between the two states, you can click the Compare to past dropdown at the top of the chart as shown below. Start by selecting the appropriate time period. For example, if the total amount of clicks on the store banner was 1200 for the past week, you can compare that to the current week to determine if the feature is making a positive impact.
To make remembering a specific time period easy and to keep track of your feature flag changes you can add it to your charts on amplitude.
Final thoughts
A/B testing takes most of the decision strain off our shoulders because we can depend on users to guide our decision. It's also worth noting that ConfigCat’s feature flag services help facilitate A/B testing, making the entire testing experience even easier. Using such a service, we can toggle experimental features on or off quickly from a 10-minute trainable feature flag management interface without changing or redeploying our code. You can even target specific user segments and connect your ConfigCat account to Amplitude as we discussed earlier.
You can find ConfigCat on Twitter, Facebook, LinkedIn, and GitHub.