A/B Testing with Feature Flags: How It Works and When to Use It


A feature can work perfectly and still make the product worse. Imagine your team builds a new search-ranking algorithm that performs well in internal tests. Instead of releasing it to everyone, you can use a feature flag to show it to a percentage of users and compare how they behave.
Feature flags control who receives each variation, while your analytics platform measures the outcome. Together, they make it possible to test meaningful product changes, limit risk, and roll out the winning version without another deployment.
What Is A/B Testing?
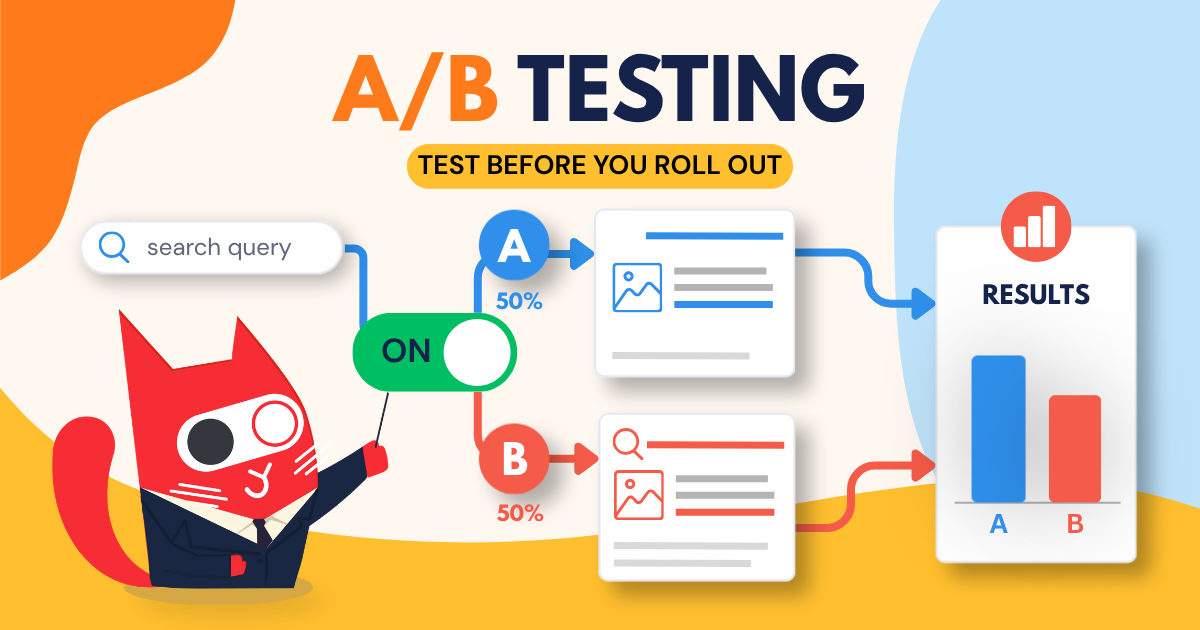
A/B testing is a controlled experiment that compares two versions of a product experience. A control group, or variation A, receives the existing experience. The treatment group, or variation B, receives the proposed change. The groups are then compared using a metric selected before the experiment begins.
In our search-ranking example:
- Control: the current ranking algorithm
- Treatment: the new ranking algorithm
- Primary metric: the percentage of searches that lead to a useful result within 30 seconds
The primary metric is the main outcome used to judge the experiment. Depending on the feature, it could measure:
- conversion
- task completion
- feature adoption
- retention
- revenue per user
- or another behavior connected to the expected improvement
If the new algorithm produces more result clicks, that is an encouraging signal, but it does not automatically make the treatment a winner. The team still needs to assess the reliability and size of the improvement, along with possible side effects such as slower searches, higher infrastructure costs, or more repeated queries.
A useful A/B test therefore involves more than dividing traffic: it needs a clear hypothesis, consistent assignment, reliable measurement, and a plan for interpreting the result.
How Do Feature Flags Work with A/B Testing?
A feature flag lets an application choose between different behaviors without requiring a separate deployment for each variation.
Both search algorithms can exist in the deployed application, while the evaluated flag value determines which one handles the request:
const useNewRanking = await configCatClient.getValueAsync(
  "useNewSearchRanking",
  false,
  {
    identifier: currentUser.id,
    country: currentUser.country,
    plan: currentUser.plan
  }
);

const results = useNewRanking
  ? await runNewRankingAlgorithm(query)
  : await runCurrentRankingAlgorithm(query);
The feature flag becomes the delivery layer of the experiment. It can:
- limit the test to an eligible audience
- assign participants to variations
- keep assignments consistent
- disable a harmful treatment quickly
- and release the winning variation gradually
In ConfigCat, targeting rules define who can enter the experiment, while percentage options divide matching users or accounts between different values. Percentage grouping is based on a selected evaluation attribute and is designed to remain consistent across ConfigCat SDKs.
Feature flags do not replace an analytics or experimentation platform. ConfigCat determines which variation is delivered, while your analytics system connects that exposure to later user behavior and helps you analyze the outcome.
Put simply, feature flags control the experience, while analytics measure its effect.
A/B Test vs Percentage Rollout
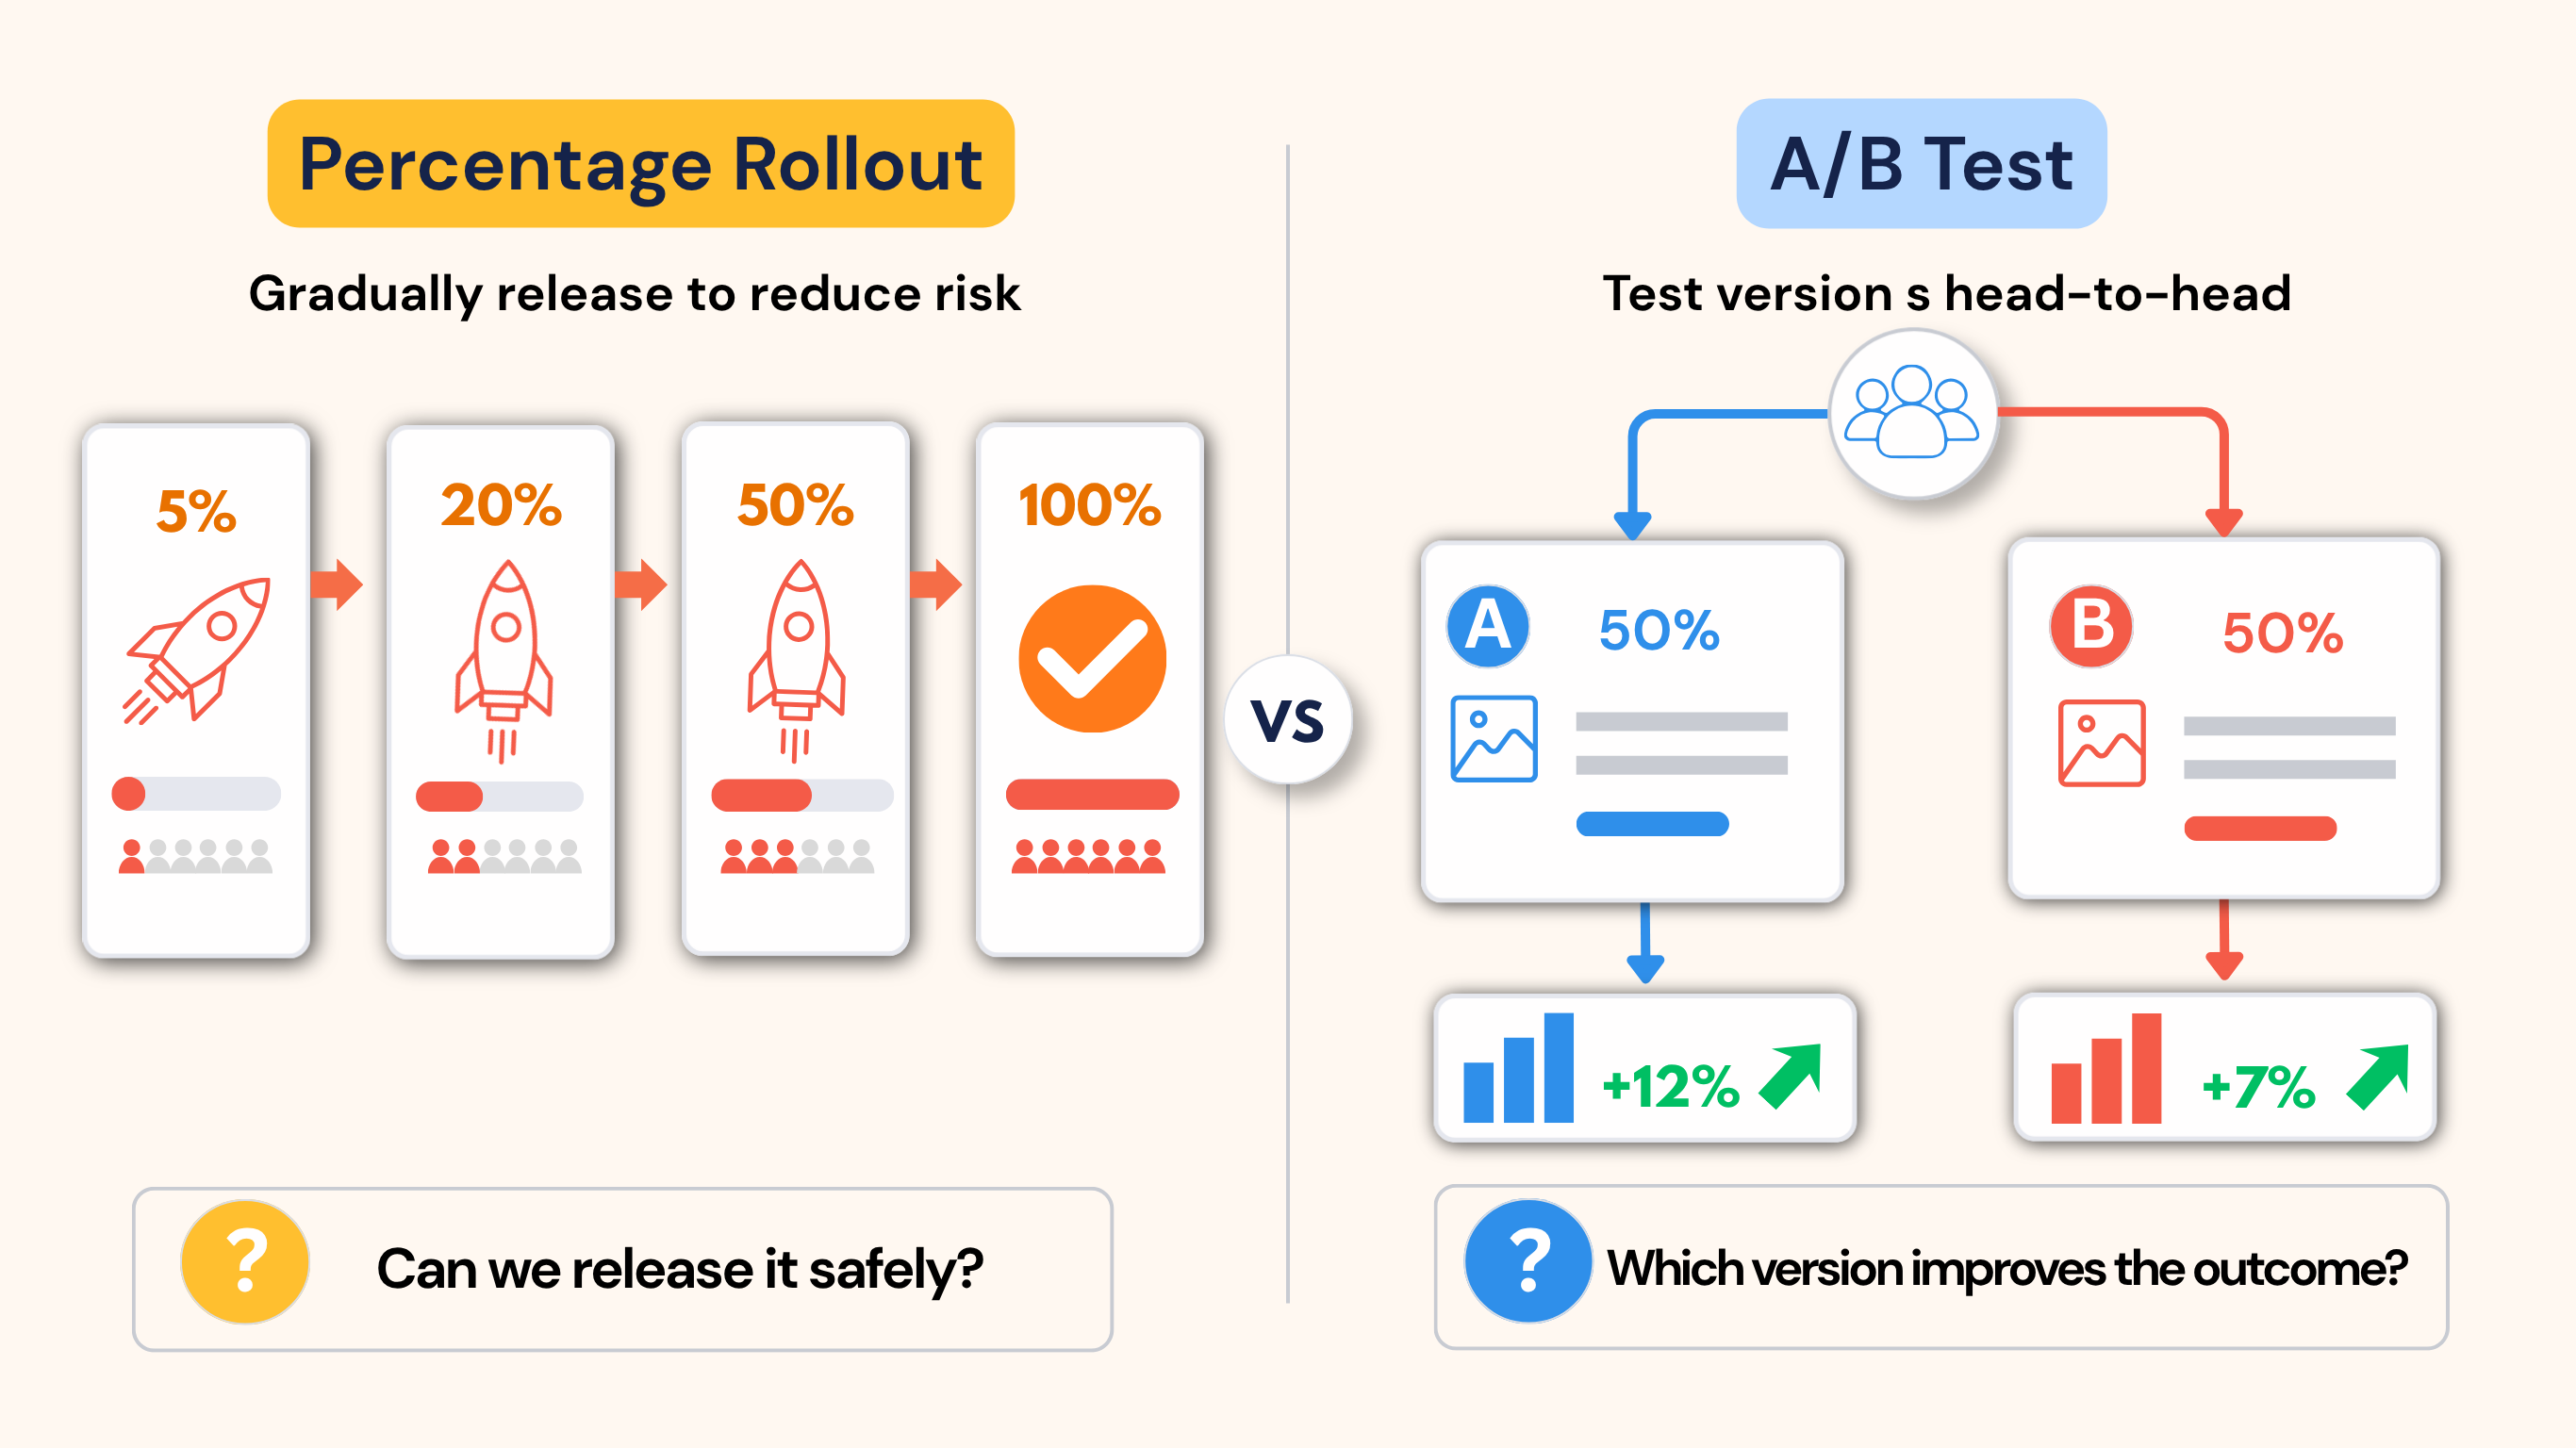
A percentage rollout and an A/B test can use the same feature flag configuration, but they answer different questions.
| Percentage rollout | A/B test |
|---|---|
| Reduces release risk | Measures product impact |
| Exposure usually increases over time | Groups remain comparable during the test |
| Focuses on errors, latency, and stability | Focuses on behavioral and business outcomes |
| Often ends with 100% exposure | Ends with a product decision |
During a rollout, the team may enable the new search service for 5% of users, monitor technical performance, and then increase exposure to 20%, 50%, and eventually 100%.
An A/B test keeps the control and treatment groups comparable while measuring a predefined outcome. In this example, the team wants to learn whether the new ranking algorithm helps users find relevant results more effectively.
A single feature flag can support both processes. The team can run the experiment first, identify the stronger variation, and then use a progressive delivery strategy to release it more broadly.
The percentage split alone does not create an experiment. It only controls who sees each version.
How Does an A/B Test Work with Feature Flags?
1. Start with a measurable problem
An experiment should begin with evidence that something is not working as expected. In our example, product analytics may show that users repeatedly reformulate the same query. Support requests may indicate that recently created content is difficult to find, while usability sessions may reveal that people scan the first page of results without opening anything.
These signals point toward a real problem: the current ranking may not place the most useful results high enough.
A useful experiment plan could look like this:
- Problem: users struggle to find relevant workspace content
- Treatment: a new ranking algorithm prioritizes recent and contextually related items
- Audience: authenticated users searching eligible workspaces
- Primary metric: searches leading to a useful result click within 30 seconds
- Guardrails: search latency, repeated queries, errors, and abandonment
- Assignment unit: Workspace ID
This lightweight brief gives the team enough structure to make the experiment interpretable without overcomplicating the setup.
Turn this plan into a testable hypothesis:
If authenticated workspace users receive the new ranking algorithm, more searches will lead to a useful result within 30 seconds, because recently accessed and contextually relevant items will appear higher in the results.
The explanation at the end turns the experiment into a test of an assumption rather than a contest between two implementations. If the treatment loses, the result can still be useful. Ranking relevance may not be the main reason users abandon search. The real issue could involve missing filters, unclear result labels, incomplete indexing, or slow response time.
A valuable A/B test produces knowledge even when the treatment does not win.
2. Choose metrics that represent user success
Select the primary metric before starting the experiment. A raw click-through rate may appear suitable for the search test, but more clicks do not always mean better results. Users may simply be clicking through several irrelevant results.
A stronger metric could count a search as successful only when the result leads to a meaningful follow-up action, such as editing a document, completing a task, or remaining on the selected page long enough to suggest it was useful.
The best metric is not necessarily the easiest to collect. It is the one that most closely represents the outcome the feature is designed to improve.
You should also define guardrail metrics, which track possible negative side effects. For this experiment, they might include:
- search latency;
- error rate;
- query reformulation;
- abandonment;
- and infrastructure cost.
The new algorithm could improve successful searches while making the entire experience slower. Guardrails help prevent the team from improving one number while damaging the product elsewhere. Microsoft's experimentation guidance similarly recommends combining feature metrics with user-satisfaction, guardrail, and data-quality metrics.
Decide how large the improvement needs to be before the test begins. A detectable increase may still be too small to justify additional cost, complexity, or maintenance.
The smallest improvement an experiment is designed to detect is often called the minimum detectable effect. Set it around a change that would genuinely influence the product decision, not simply the smallest difference your analytics platform can detect.
3. Define the audience and assignment unit
The eligibility criteria determine which users or accounts can enter the experiment. The ranking test may apply only to authenticated users on supported application versions and workspaces with enough indexed content. You may also want to exclude internal accounts, automated traffic, and customers outside the intended audience.
ConfigCat targeting can use a User Object containing attributes such as the user identifier, plan, country, workspace ID, or organization ID. The SDK evaluates those attributes against the targeting configuration.
const user = {
  identifier: currentUser.id,
  workspaceId: currentWorkspace.id,
  plan: currentWorkspace.plan,
  country: currentUser.country
};
The assignment unit is the entity placed into a variation. It can be a user, device, account, workspace, organization, or tenant.
For consumer products, individual user assignment often works well. In collaborative B2B products, account-level or workspace-level assignment may produce cleaner results.
If colleagues in the same workspace receive different ranking algorithms, they may see conflicting result orders or influence the same shared data. Assigning the entire workspace to one variation avoids that overlap.
Match the percentage evaluation attribute to the level at which participants share data and influence each other. For many B2B experiments, a stable tenant or workspace ID is more suitable than an individual user ID.
Avoid temporary session identifiers and frequently changing attributes. They can move participants between variations and weaken the experiment.
4. Configure and evaluate the variations
A boolean flag works well for two versions:
false/ Off: current ranking algorithmtrue/ On: new ranking algorithm
Keep the current production behavior as the default and SDK fallback. In this example, the application uses the existing ranking algorithm unless the flag returns true.
const useNewRanking = await configCatClient.getValueAsync(
  "useNewSearchRanking",
  false,
  user
);

const results = useNewRanking
  ? await runNewRankingAlgorithm(query)
  : await runCurrentRankingAlgorithm(query);
Split all identified users
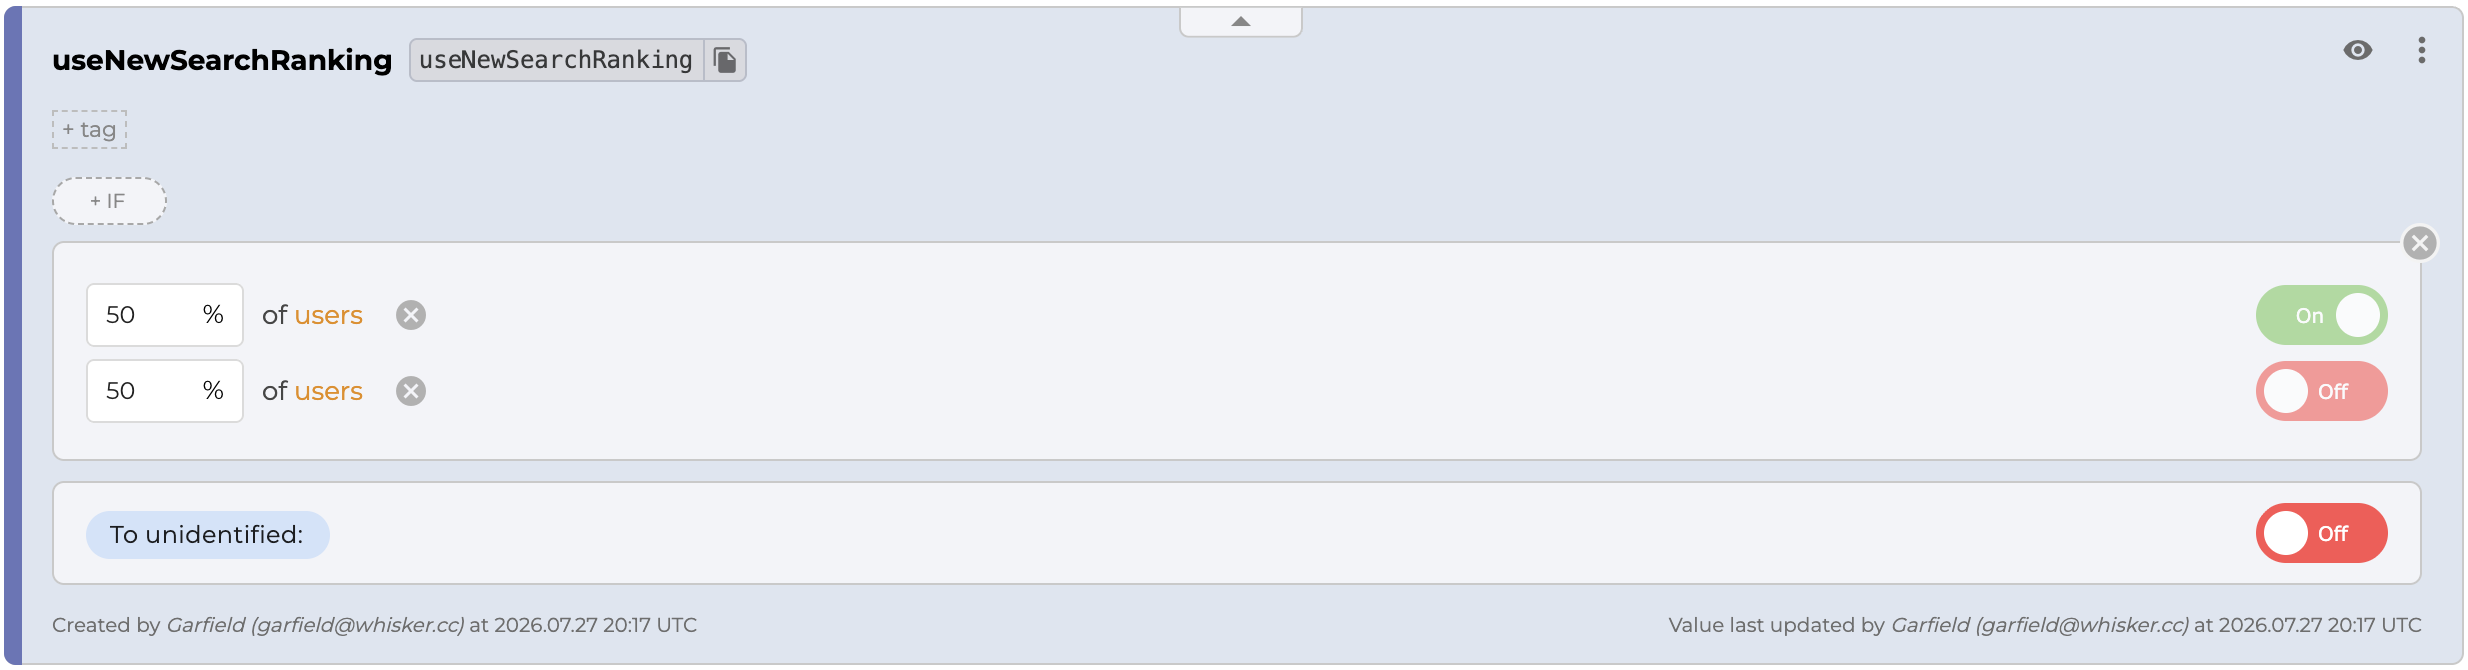
For a simple experiment, you can divide all identified users evenly:
- 50% Off: control group using the current ranking
- 50% On: treatment group using the new ranking
Users who cannot be evaluated for the percentage split continue receiving Off, keeping the existing production behavior as the safe fallback.
Limit the experiment to an eligible audience
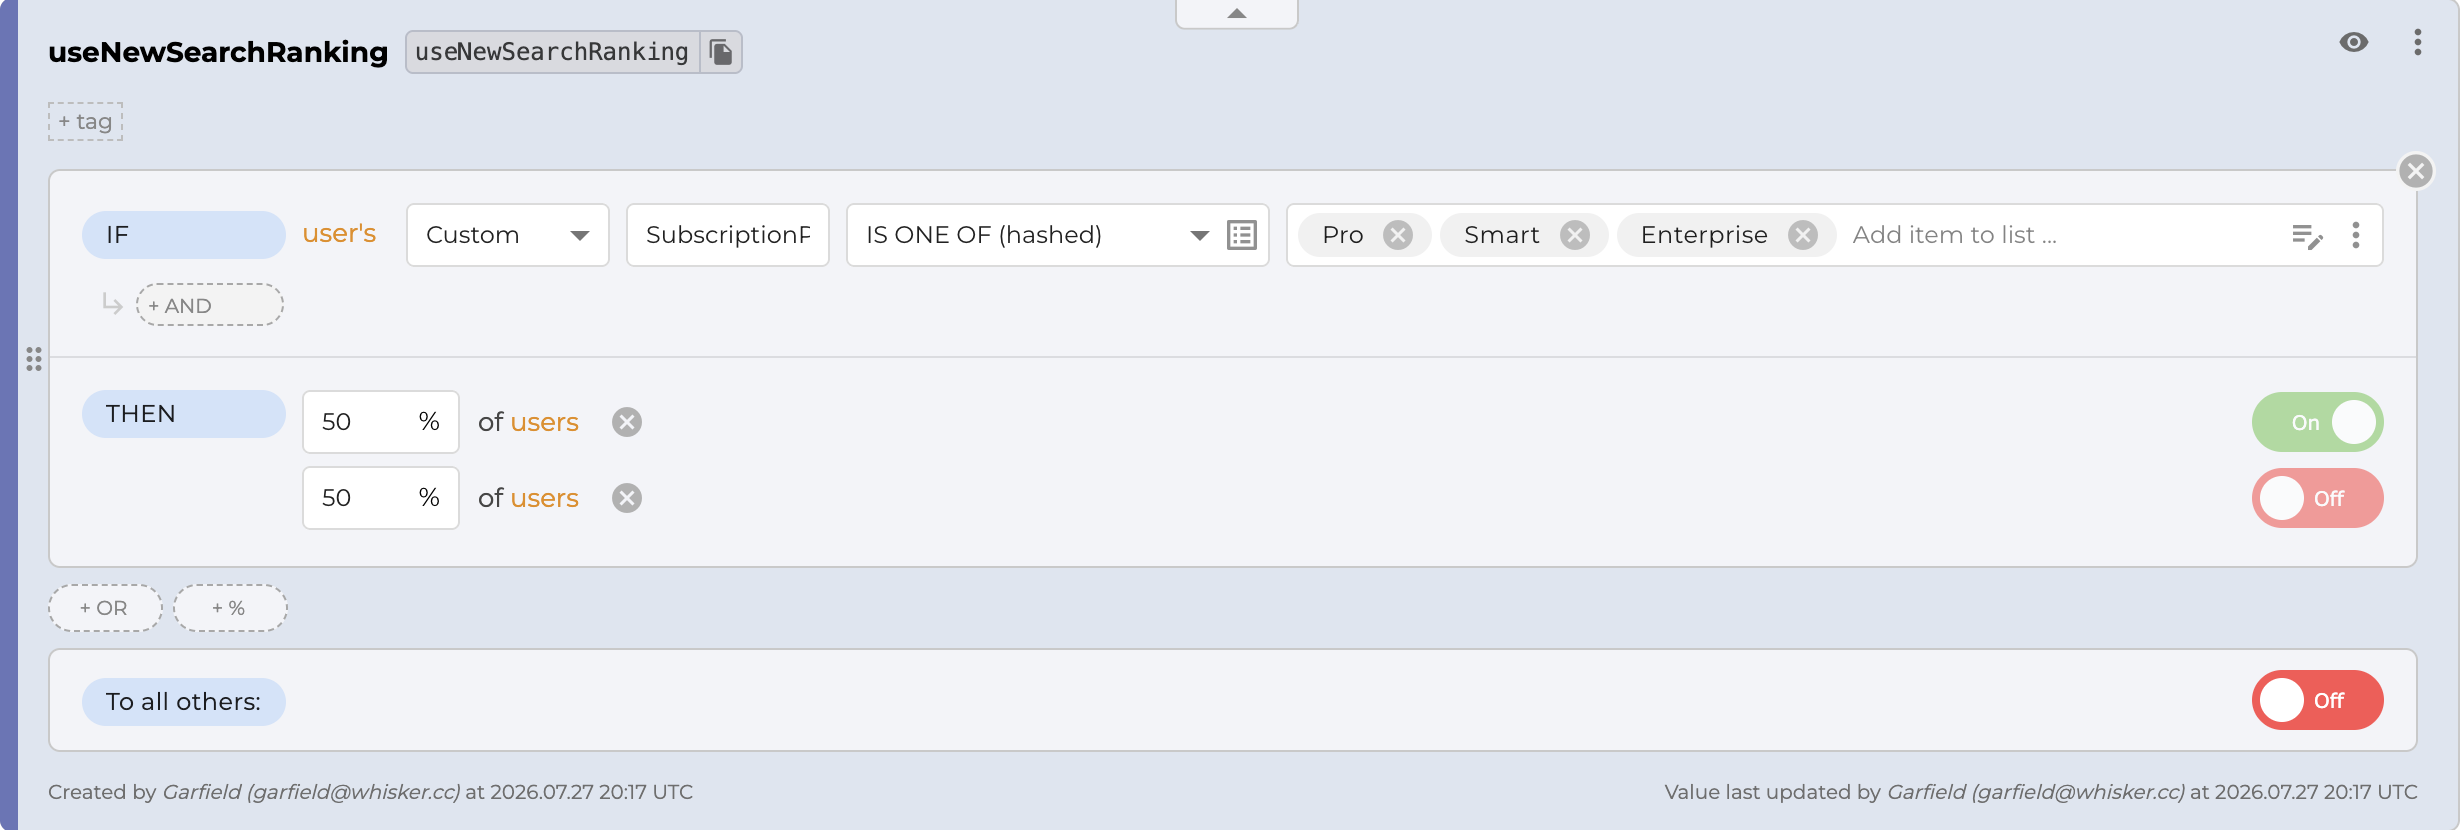
A more controlled experiment can place the percentage options inside a targeting rule. In the example below, only users on the Pro, Smart, or Enterprise plans enter the test. ConfigCat divides that eligible audience evenly between On and Off, while everyone else continues receiving Off.
Experiments with more than two versions can use a text setting with values such as control, semantic, and hybrid. Because every additional variation divides the available traffic, add one only when it represents a distinct hypothesis and your audience can support the comparison.
5. Track exposure, not only assignment
Assignment and exposure are not the same event. Assignment places a participant into a variation, while exposure occurs when that participant actually encounters the experimental feature. A workspace may belong to the treatment group without anyone performing a search during the experiment. Counting it as exposed can dilute the measured effect.
In our example, exposure occurs when an eligible search evaluates the flag and then the chosen algorithm handles the query.
An exposure event should normally contain:
- the experiment or flag key;
- the evaluated variation;
- the user, workspace, or account identifier;
- the timestamp;
- the environment;
- and the relevant Variation ID.
ConfigCat creates a Variation ID for each distinct served value. The ID can help an analytics platform distinguish the exact rule or percentage option that produced a result, even when several rules return the same raw value.
Do not record exposure simply because the application is loaded. Record it when the experimental feature actually affects the experience.
This distinction keeps the measured population closer to the users who actually experienced the change.
6. Connect ConfigCat with analytics
Once the feature flag delivers a variation, an analytics platform needs to connect that exposure with the participant's later behavior.
ConfigCat deliberately separates feature delivery from behavioral analytics. Its SDKs evaluate flags locally using the downloaded configuration and the User Object supplied by your application. ConfigCat does not receive or store the User Object attributes used during evaluation. The data flow is one-way, from ConfigCat's CDN to the SDK. This means behavioral and experiment data can remain in the systems your team already controls.
ConfigCat supports integrations with Amplitude, Mixpanel, Datadog, Google Analytics, and Twilio Segment. These integrations can connect feature flag evaluation data with an existing analytics workflow.
7. Validate the experiment before trusting the results
Before directing substantial traffic into the test, validate the complete path from assignment to measurement.
Check that:
- eligible participants enter the experiment
- excluded users remain outside it
- the same workspace receives a consistent variation
- the control matches the existing production behavior
- exposure events contain the correct identifiers
- outcome events connect to the correct variation
- and the recorded group sizes broadly match the configured allocation
A large difference between an intended 50/50 split and the recorded groups may indicate a problem with targeting, identifiers, exposure, logging, or data processing.
Test both code paths and inspect the analytics events before treating the results as evidence. A correct flag configuration does not guarantee correct experiment measurement.
Avoid changing the audience, primary metric, traffic split, or treatment while the experiment is running. Doing so changes the experiment and makes the final comparison harder to interpret.
A serious technical or user-facing problem is a valid reason to stop early. Feature flags make this response faster because the treatment can be disabled without another deployment.
8. Analyze the result and roll out the winner
An experiment can end with three sensible outcomes:
- the treatment wins;
- the control remains preferable;
- or the result is inconclusive.
An inconclusive result does not prove that both variations perform identically. The sample may be too small, the metric may be too noisy, or the real effect may be smaller than the test was designed to detect.
The final decision should consider practical value alongside statistical evidence. A small improvement may not justify increased infrastructure costs, maintenance, or architectural complexity.
A concise scorecard might look like this:
| Metric | Control | Treatment | Interpretation |
|---|---|---|---|
| Useful search results | 35.0% | 38.1% | Improved |
| Repeated queries | 18.2% | 14.9% | Improved |
| Median latency | 180 ms | 240 ms | Needs monitoring |
| Error rate | 0.20% | 0.21% | No meaningful change |
In this example, the treatment improves the primary user outcome and reduces repeated queries, but the team still needs to monitor latency.
A winning A/B test does not make an immediate release to every user risk-free. Full exposure can create additional infrastructure load or reveal operational effects that were not visible during the experiment.
Use the same flag to increase exposure gradually and continue monitoring the guardrails. For higher-risk changes, a canary release with feature flags can add another controlled validation stage before the full rollout.
Once the new version is stable, make it the default, remove the losing code path, and retire the experiment flag.
What Are the Most Common A/B Testing Mistakes?
Even a technically correct flag configuration can support a weak experiment. Before starting a test, watch for these common mistakes:
Treating a percentage split as a complete experiment
A 50/50 split controls variation delivery. It does not define the hypothesis, select the metrics, record exposure, or analyze the result.
Measuring the easiest event instead of user success
Clicks are simple to track, but they may not represent a useful outcome. Connect the primary metric to the problem the feature is meant to solve.
Using an unstable assignment attribute
Changing identifiers can move participants between groups. Use a stable user, account, workspace, or tenant value.
Assigning the wrong entity
In collaborative products, people within the same workspace may influence one another. Assigning the workspace rather than each individual can create a cleaner comparison.
Counting assignment as exposure
Participants should enter the measured population when they encounter the experimental experience, not merely when they become eligible for it.
Changing the test midway
Changing the audience, metric, allocation, or treatment makes the final result harder to interpret.
Ignoring guardrails
A treatment can improve the primary metric while harming latency, reliability, retention, or cost.
Leaving completed experiment flags behind
Temporary experiment flags become technical debt when the losing path and dashboard configuration remain after the decision.
Put A/B Testing into Practice
The experiment design stays broadly the same across platforms, but the implementation depends on your SDK, application architecture, and analytics stack. For a complete walkthrough, choose a guide that matches the environment where your feature runs:
- How to Conduct an A/B Test in Elixir
- How to A/B Test Your Python Application
- How to Perform an A/B Test in Nuxt.js
- How to Implement A/B Tests in GODOT
- A/B Testing in Java with ConfigCat and Amplitude
- A/B Testing React Native Apps with Feature Flags
- A/B Testing in Ruby Using Feature Flags
- A/B Testing in PHP with Feature Flags and Amplitude
- A/B Testing with ConfigCat and Google Analytics
Turn Better Experiments into Safer Releases
Feature flags make A/B testing easier to control, but the quality of the result still depends on the experiment behind the split.
The flag determines who experiences the change; your analytics system measures what happens afterward. The quality of the experiment comes from everything connecting those two moments: a clear hypothesis, stable assignment, meaningful metrics, accurate exposure tracking, and predefined decision criteria.
With ConfigCat, you can use targeting rules and percentage options to deliver the variations, keep assignments consistent, disable a problematic treatment quickly, and gradually roll out the version you decide to keep. Your analytics platform handles the behavioral measurement and experiment analysis.
Ready to test your next product idea with feature flags? Create a free ConfigCat account and set up your first controlled experiment in minutes.
Happy feature flagging! 🚀
You can stay up to date with ConfigCat on X, Facebook, LinkedIn, GitHub, and the News & Product Updates page.