A/B Testing with ConfigCat and Google Analytics

Suppose you come up with an idea to improve the conversion rates on your website. You could implement the idea and roll out the changes to all users. But what happens if the idea is only good on paper and fails in reality? In cases like this, conducting an A/B test is an excellent way to validate your idea.
In the upcoming sections, we'll learn how to set up an A/B test using ConfigCat feature flags and visualize the test's data in Google Analytics.

Using Feature Flags for A/B Testing
Feature flags (or feature toggles) are virtual switches you can use to turn features in your app on or off without redeploying code. Feature flags are commonly used for gradually rolling out features, running beta tests, quickly rolling back features, etc.
An A/B test involves comparing two variations of a webpage, email, or other digital content to see which delivers better results. Using a feature flag, you can toggle variation A (the new feature you want to measure) for 50% of users while keeping variation B (the control) on for the remaining users. During the test, events are tracked and recorded on an analytics platform to help you select the best variation.
Demo
Prerequisites
- Basic knowledge of Google Analytics
- Knowledge of Vue.js 3 and JavaScript
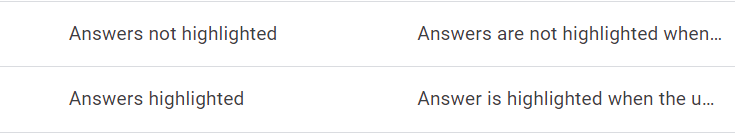
To demonstrate, I built an animal quiz game where players listen to an animal's sound and select the correct answer from four options. Currently, the players don't see the correct answer when they choose an option. They only see their scores at the end of the game, leaving them to guess which questions they got wrong.
While the current design makes the game fun and generates curiosity, I think highlighting the answers will encourage users to play longer to beat their high scores.
Let's use an A/B test to determine which variation users like the most.
-
Sign up for a free ConfigCat account, or log in if you already have one.
-
Click the "ADD FEATURE FLAG" button, name the feature flag "Highlight answer" and give it the following hint: "Highlight the correct answer when a user selects an option."
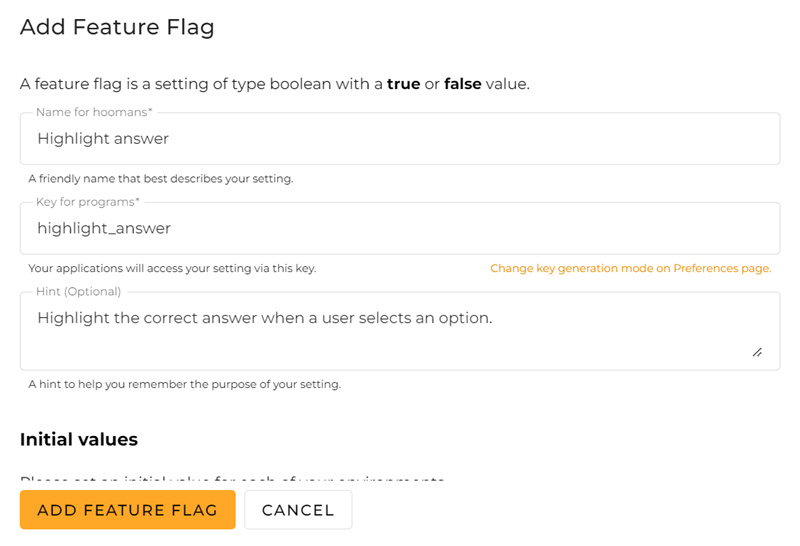
- Click "ADD FEATURE FLAG" to create the flag, then click the
+%button to target a percentage of users.
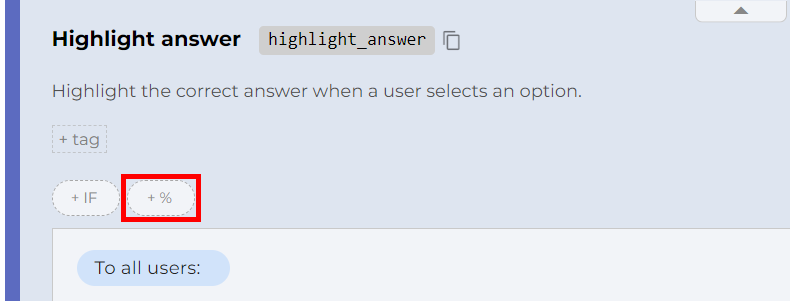
You should see 50% of users in both fields. Leave the values as they are since only half of the users should see the highlight feature.
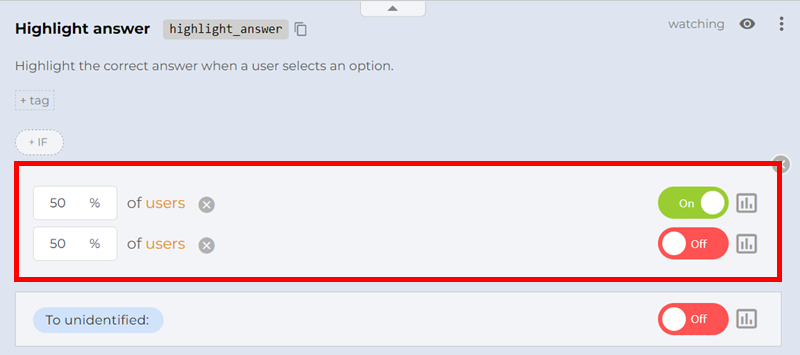
- Click "SAVE & PUBLISH CHANGES".
Using the Feature Flag
You'll need to install a ConfigCat SDK before you can use feature flags in your app. We'll use ConfigCat's Vue SDK since our sample app was built with Vue.js.
- Open your terminal and install ConfigCat's Vue SDK.
npm install configcat-vue
- Import
configcat-vueinmain.jsand initialize the ConfigCat client:
// other imports
import { ConfigCatPlugin } from 'configcat-vue';

const app = createApp(App);

app.use(createPinia());

app.use(ConfigCatPlugin, {
  // Don't forget to put in your actual SDK key below
  sdkKey: 'YOUR-SDK-KEY',
});

app.mount('#app');
ConfigCatPlugin creates a ConfigCat client with the given SDK key and makes it available to other Vue components. ConfigCat will download and cache the latest feature flag values every 60 seconds by default. You can check out other configuration options in the documentation.
- Open
src/components/Question.vueand add this CSS class to the<style>section.
.correct__option {
  background-color: lime;
}
- Add the following code to the
<script>section ofQuestion.vue.
import { inject, onBeforeMount, ref } from 'vue';
import { User } from 'configcat-vue';
import { useUserStore } from '@/stores/user';

// Inject the ConfigCat client
const configCatClient = inject('configCatClient');
let isAnswerHighlightEnabled;

// Add these after defining props and events

onBeforeMount(() => {
  setHighlightStatus();
});

async function setHighlightStatus() {
  // get the value of the Highlight answer feature flag
  isAnswerHighlightEnabled = await configCatClient.getValueAsync(
    'highlight_answer',
    false,
    new User(useUserStore().userID),
  );
}
In the snippet above, I accessed the ConfigCat client and called setHighlightStatus() to fetch the value of the feature flag. ConfigCat requires unique user identification when using the targeting feature, so I also created a ConfigCat user object and assigned it a unique ID from the user store.
- Finally, add the
correct__optionclass to the option button:
<template>
  <div>
    <div class="options">
      <button
        v-for="(option, index) in question.options"
        :id="`option${index + 1}`"
        class="btn option"
        :class="{ correct__option: (optionsDisabled && option === question.answer && isAnswerHighlightEnabled) }"
        :disabled="optionsDisabled"
        @click="selectOption(option)"
      >
        {{option}}
      </button>
    </div>
  </div>
</template>
I'm using Vue's conditional classes to highlight the correct option when the feature flag is enabled. Let's now turn our attention to Google Analytics.
Setting up Google Analytics
Google Analytics is a popular online analytics platform that allows individuals and organizations to gain insights into user interactions. For this demo, we'll use ConfigCat's Google Analytics integration to gather and visualize event data for our A/B test.
- Following the instructions on adding Google Analytics to a website, I'll add the following code after the
<head>tag inindex.html.
<!-- Google tag (gtag.js) -->
<script
  async
  src="https://www.googletagmanager.com/gtag/js?id=YOUR-MEASUREMENT-ID"
></script>
<script>
  window.dataLayer = window.dataLayer || [];
  function gtag() {
    dataLayer.push(arguments);
  }
  gtag('js', new Date());

  // send the userID to Google Analytics
  gtag('config', 'YOUR-MEASUREMENT-ID', {
    user_id: localStorage.getItem('userID'),
  });
</script>
In the snippet above, I set up Google Analytics on the web page and set the user ID I generated for the player. The user ID helps Google Analytics track users across different devices and is always generated by the website owners. In this case, I'm keeping things simple by using a randomly generated ID stored in local storage. But in a real-world app, you'll probably have a database where you store your user IDs.
Google Analytics doesn't allow you to use emails or any other form of Personal Identifiable Information (PII) for your user IDs. Read the documentation for more about the rules and limitations for user IDs.
- Add a restart event to the top of
QuizContainer.vue:
function restart() {
  // send the restart event to Google Analytics
  gtag('event', 'restart');
  emit('generateQuestions');

  questionCounter.value = 0;
  currentQuestion.value = props.questions[questionCounter.value];
  score = 0;
  optionsDisabled.value = false;
}
I'll use the restart event to track the number of times users restart the game after a session.
Google Analytics will start tracking the events when users play the game, but it won't be able to identify which variation they belong to. I'll solve this issue with variation IDs.
Sending ConfigCat Variations to Google Analytics
Whenever you create a targeting rule in ConfigCat, each variation gets a unique ID. I'll send the variation IDs to Google Analytics so it can match events to their correct variation.
Update onBeforeMount in Question.vue with the following code:
onBeforeMount(() => {
  configCatClient.on('flagEvaluated', (evaluationDetails) => {
    // send feature flag information to Google Analytics
    const variant =
      'configcat-' + evaluationDetails.key + '-' + evaluationDetails.value;
    gtag('event', 'experience_impression', {
      exp_variant_string: variant,
      variation_id: evaluationDetails.variationId,
    });
  });

  setHighlightStatus();
});
I'm using the flagEvaluated hook with a special gtag event called experience_impression to send data whenever the app evaluates (checks the value of) the feature flag. The experience_impression event takes the parameters exp_variant_string and variation_id that we can use to segment users in Google Analytics. For example, if a user is in the control group with a variation ID of 64c323sh, the event's parameters will evaluate to:
{
  'exp_variant_string': 'configcat-highlight_answer-false',
  'variation_id': '64c323sh'
}
For the final step, I'll create audiences in Google Analytics based on the variation data it receives from the game.
Creating Audiences in Google Analytics
You can use Audiences in Google Analytics to segment users based on the actions they perform or properties they share. For example, in a SaaS app, you can create an audience for customers in a particular country to analyze their behaviors compared to customers in other countries.
Before creating audiences for the variations you created in ConfigCat, you may have to wait for up to 24-48 hours for the events' data to reach Google Analytics. However, you can confirm that users are firing the events by checking the Realtime reports page in your Google Analytics dashboard.
Once Google Analytics has received the events data, follow these steps to create audiences:
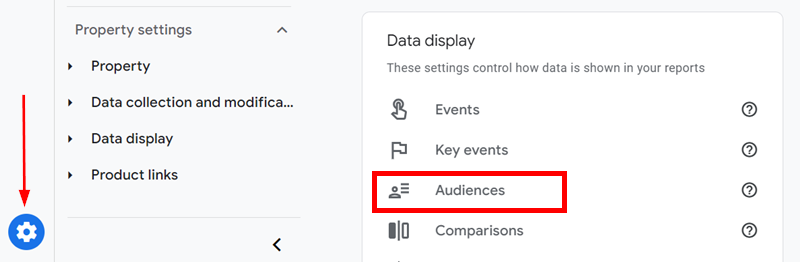
- Go to the Admin page on your dashboard and select "Audiences" under "Data Display".
- Select "New Audience", then "Create a custom audience".
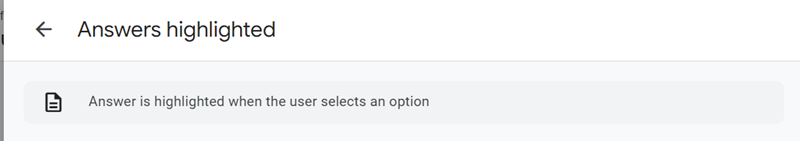
- Name the audience "Answers highlighted" and give it a description.
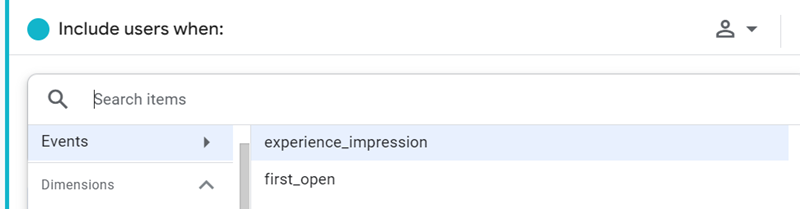
- Click "Add new condition".
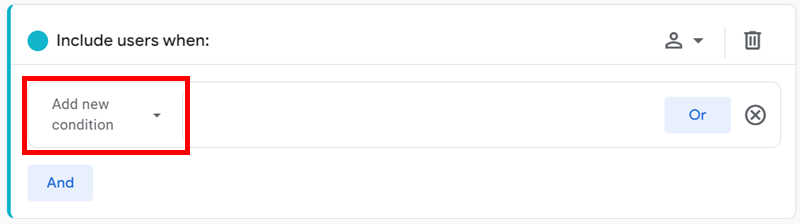
- Click "Events", then select
experience_impressionfrom the list.
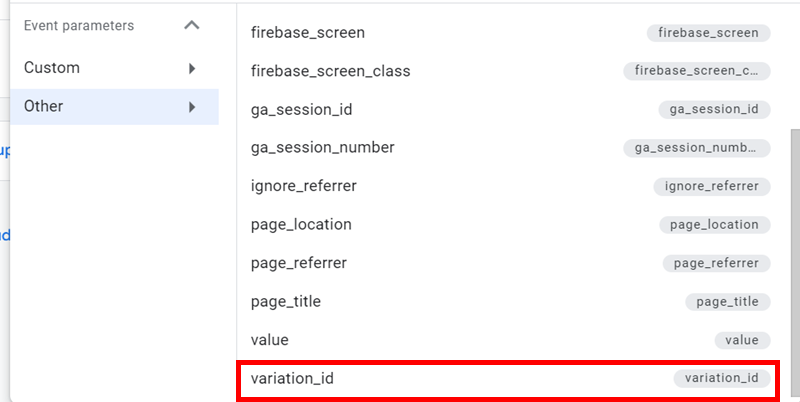
- Click "Add parameter" and select
variation_idunder "Other".
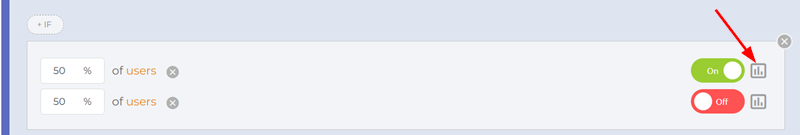
- Go to your ConfigCat dashboard and copy the variation ID for the feature flag that's turned on.
- Back in Google Analytics, select "exactly matches(=)" under Condition and paste the variation ID you copied into the field.
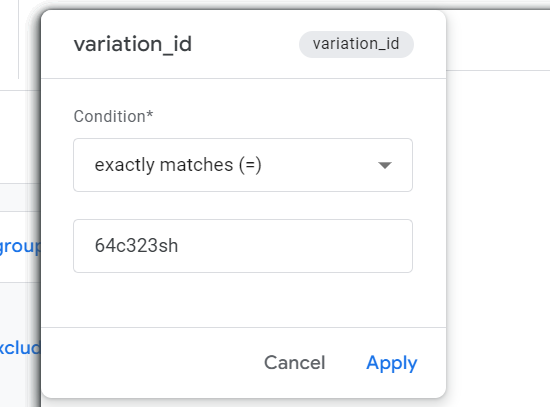
- Click "Apply" then "Save" in the top right corner.
Follow steps 2-9 above to create an audience for the other variation. But in this case, copy the variation ID for the other fifty percent of users who do not have the flag turned on.
With the audiences created, I can build reports to analyze the data.
Visualizing Data from the A/B Test
You may have to wait another 24-48 hours before Google Analytics includes users in your audiences. After that, you can follow these steps to view the data:
- Go to the Reports page and select "Events" from the sidebar.
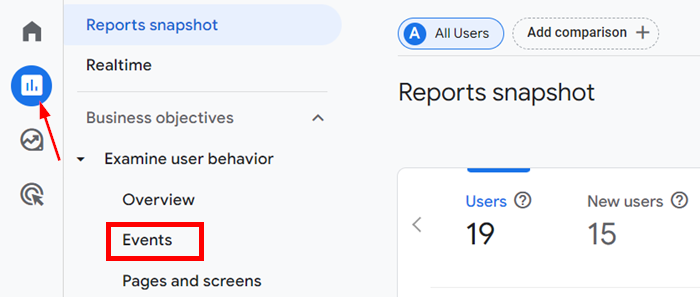
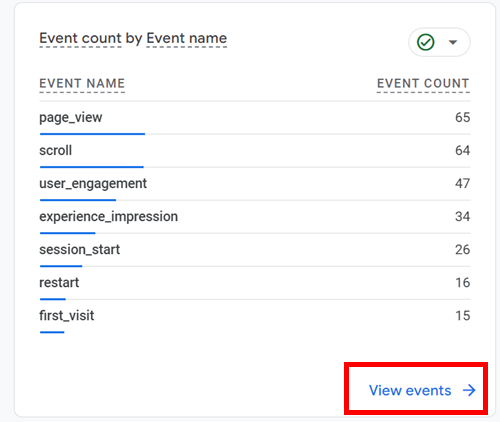
You can also access events from the events card in the Reports snapshot page.
- Click "Add comparison", then "Create new".
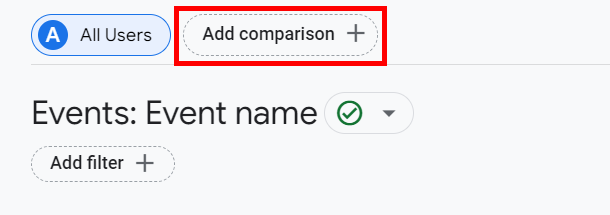
- Select "Audience name" under "Dimension", then select "exactly matches" under "Match type".
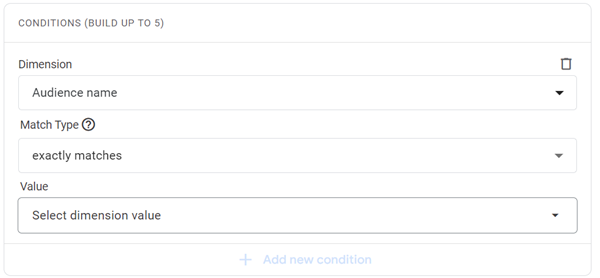
- Select "Answers highlighted" under value.
- Click "Save" in the top right corner and "Confirm" in the dialog that opens.
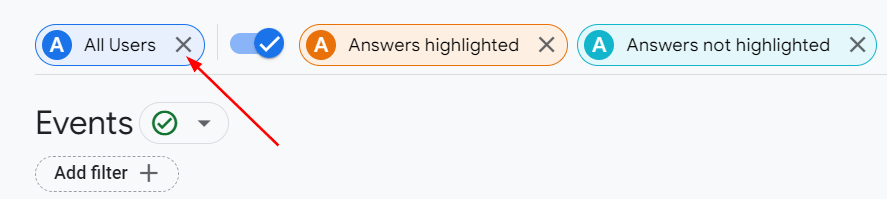
- Repeat steps 2 - 5 for the second audience, "Answers not highlighted".
- Remove the "All users" comparison.
When you've completed the steps above, your chart should look similar to this:
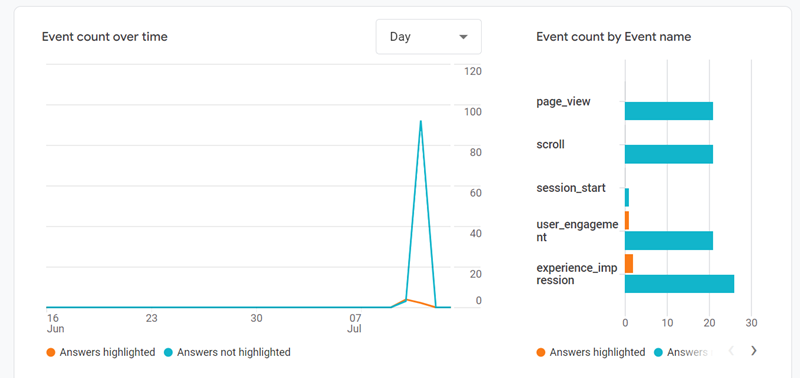
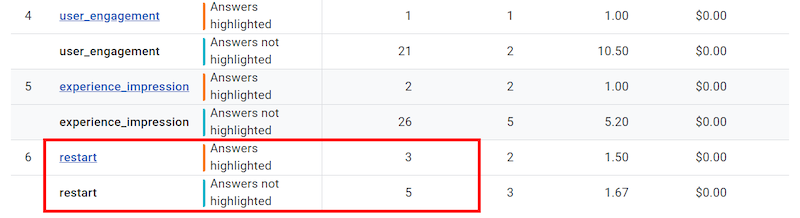
You can scroll down to see details of each event per audience.
Now, before you pick the winning variation, you'd have to wait for at least a week so you can see how users interact with the new feature over time. Also, take note of any external factors that might affect these results. You can ask users for feedback on the feature when you end the experiment so you can understand the results better.
Check out "The Role of Feature Flags in A/B Testing" for a complete, high-level guide to A/B testing.
Summary
Here's a recap of the steps I took to set up an A/B test with ConfigCat and Google Analytics. I:
- Created a percentage-based feature flag with a 50% split in ConfigCat.
- Added ConfigCat to the app.
- Added Google Analytics to the app with a unique user ID to identify each user.
- Added the restart event to track how many times users restart.
- Added the
experience_impressionevent to send feature flag data to Google Analytics. - Created audiences in Google Analytics.
- Added comparisons to analyze data for the audiences.
Resources
I hope you found this article useful. If you want to read more articles on A/B testing and other feature release strategies, check out the ConfigCat blog. You can also stay connected to ConfigCat on Facebook, X, GitHub, and LinkedIn.