A/B Testing React Native Apps with Feature Flags
Suppose you have two variations of a software product but you're not sure which one to deploy. The solution would be to conduct an A/B test in which you can release each variation to a small percentage of users. This would allow you to gather concrete evidence from real users to help you decide which variation is better without affecting your entire user base. This type of testing has proven to be useful by many software companies around the world to scale and streamline their products and services.
What is an A/B test
While A/B testing is useful and has its proven benefits, let's take a moment to understand how it works. Simply put, A/B testing is a type of testing where two variations of an app are released to a small percentage of users to determine which is better. This approach to testing lowers the probability of introducing bugs as part of a new feature because only a small percentage of users gets to see and use it while metrics and other feedback is collected.
To understand how metrics are grouped, you can use this analogy. Think of each variation as a bucket. During the test, metrics collected from variation A are placed in bucket A, and metrics from variation B are placed in bucket B. When concluding the test, the buckets are placed side-by-side for comparison. Most often, the variation with positive metrics is selected for deployment.
If you decide to focus your efforts on testing if a new variation is making a positive impact in comparison to the current variation deployed, then you can use Variation A as a control or benchmark when making a final decision. In the following test experiment, I'll show you how to A/B test a new change (Variation B) in a demo React Native app then show you how to compare the two.
The demo A/B test experiment
Consider the following A/B variations of a landing screen. On average, variation A is funneling about 400 user sign-ups per month from 10% of users. The difference between the two variations is the button text. Will a change in the button text as done in variation B influence more user sign-ups?
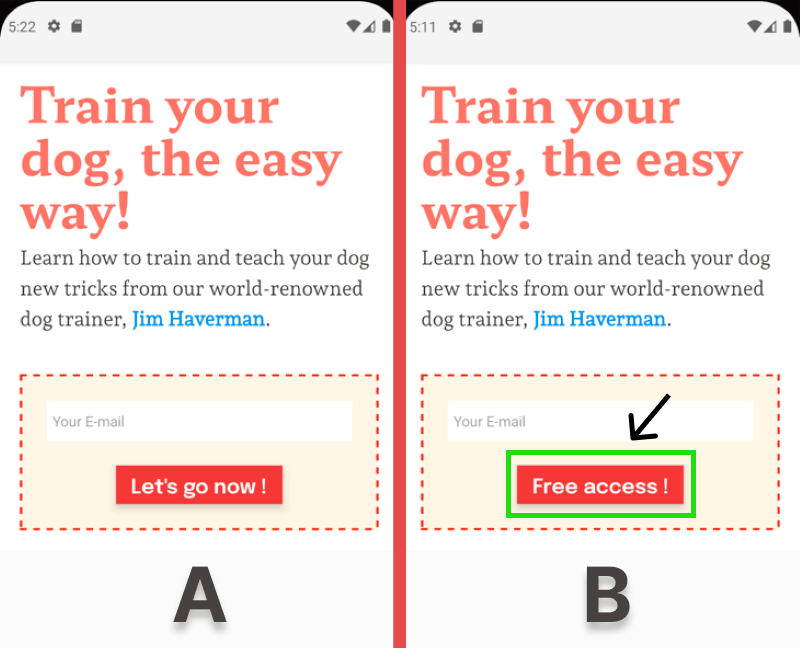
To move forward with the experiment, I'll need a way to easily switch to variation B while releasing it to only 10% of users. To do this I'll set up a feature flag and configure a user segment using ConfigCat's feature flag services. For context, ConfigCat supports simple feature toggles, user segmentation, and A/B testing and has a generous free tier for low-volume use cases or those just starting out.
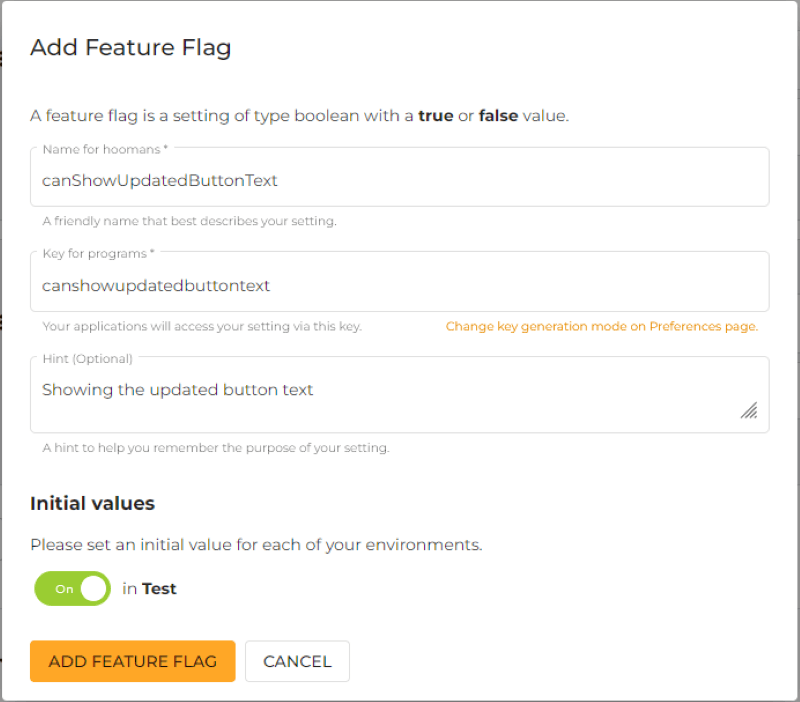
Creating a feature flag
To create the feature flag, you'll need to sign up for a free ConfigCat account.
1. In the dashboard create a feature flag with the following details:
Creating a user segment
1. Target 10% of the user base:

2. You'll then need to integrate the feature flag into your react native app as exemplified here.
With that set, let's look at how we can collect metrics from variation B.
Collecting metrics from variation B using Amplitude
To track every user sign-up event when the button is pressed I'll use Amplitude's analytics platform.
1. To use Amplitude you can sign up for a free user account.
2. Switch to the Data section by clicking the dropdown at the top left.
3. Click the Sources link under Connections in the left sidebar, then click the + Add Source button on the top right.
4. Select the React Native SDK from the SDK sources list and enter the following details to create a source:
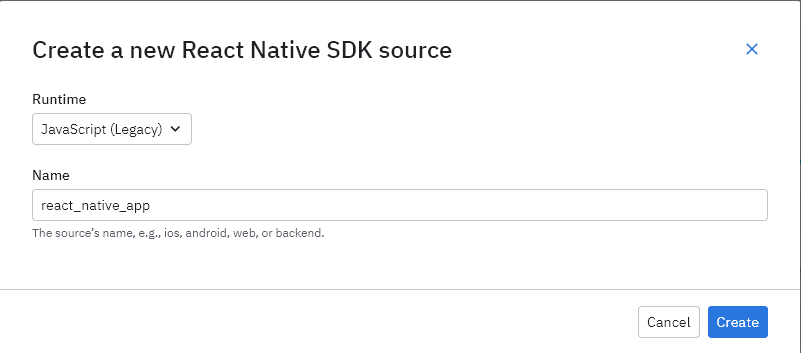
5. If all goes well, you should be automatically redirected to the implementation page. We'll revisit these instructions after adding an event.
Adding an event
1. Click the Events link in the left sidebar under Tracking Plan to access the events page.
2. Click the + Add Event button at the top right to create an event and fill in the following details:
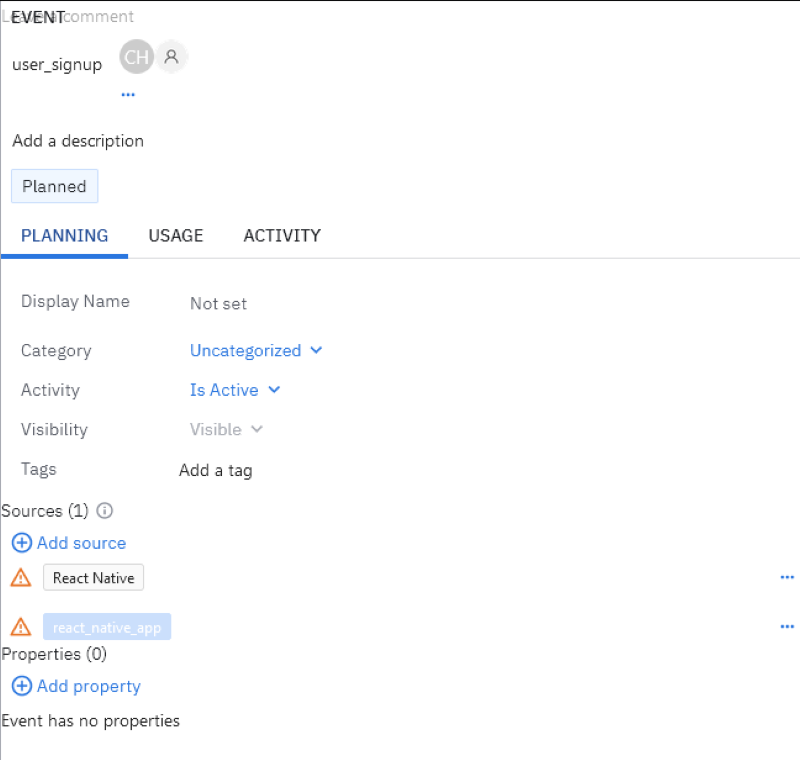
3. Click the Save changes button in the left sidebar.
Using Amplitude with React Native
Click the Implementation link in the left sidebar to see the integration instructions again.
1. Install the Amplitude CLI with the following command:
npm install -g @amplitude/ampli
2. Install the Amplitude React Native SDK:
npm install @amplitude/react-native
3. Pull the configurations from Amplitude's dashboard into React Native with the following command:
ampli pull
Sending the user sign-up event to Amplitude
1. Import Amplitude in App.js or in the file you wish to use Amplitude.
import { ampli } from './ampli';
ampli.load({ environment: 'production' });
2. I'll create a function called handleSignup that will be triggered when the sign-up button is pressed. This will in turn call the userSignup event method on the ampli instance to log the event to Amplitude:
const Signup = () => {
  function handleSignup() {
    ampli.userSignup();
  }

  return (
    // ...
    <ButtonSolid
      onPress={handleSignup}
      textStyle={styles.signupButtonText}
      style={styles.signupButton}
      title="Free access !"
    />
    // ...
  );
};
You can view the full content of this file here.
Checking the Ingestion Debugger
Let's check if Amplitude is able to receive events from the app.
1. Under Connections in the left sidebar, click on Sources.
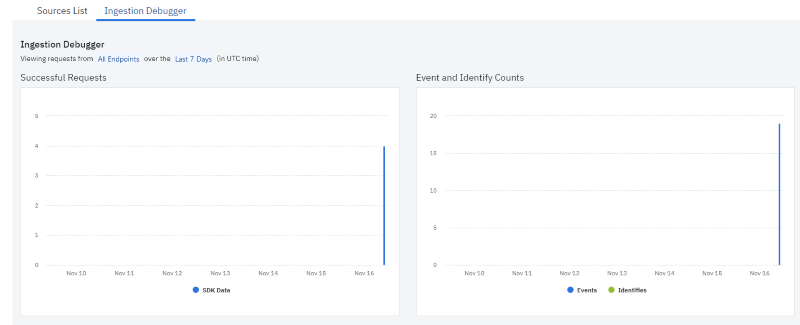
2. Click the Ingestion Debugger tab. Click on the button a few times. After a minute you should see the events logged as shown in the charts below:
Setting up an analysis chart
To analyze the events and get real-time visual insights into variation B I'll set up an Analysis chart.
1. Switch to the Analytics dashboard, by clicking the dropdown arrow on the top left next to Data.
2. In the analytics dashboard, click the New button in the left sidebar.
3. Select Analysis, then select Segmentation.
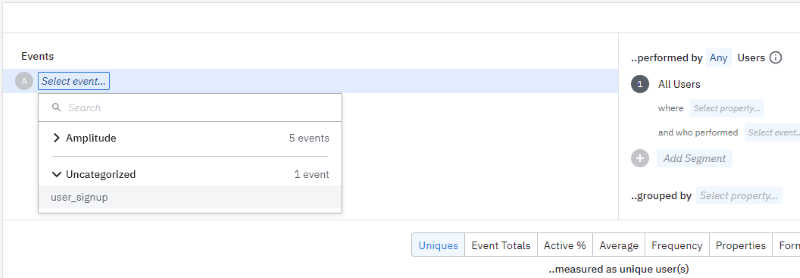
4. Select the event as shown below:
5. Click Save on the top right to save the chart.
Analyze the test results
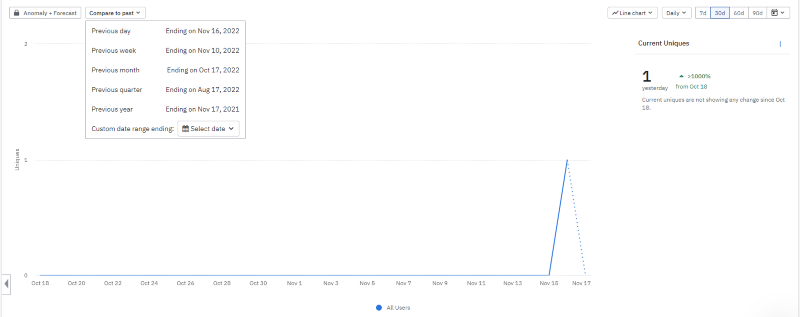
When your testing period is over you'll need to compare the results you gather to a past period. Amplitude provides an easy way to do this with the Compare to past dropdown button as shown below. This can help you make an informed decision on which variation should be rolled out or kept. ConfigCat also gives you the ability to monitor your feature flag changes in an Amplitude chart. You can read more about it here.
You can find the final app here.
Conclusion
While writing unit tests for our code can be helpful, There will be scenarios where you need to determine how a new feature will impact real users.
As we've discussed, A/B testing provides this benefit. With the help of feature flags, you can streamline this process further with the ability to switch between variations and set up user segmentation with just a few clicks by using ConfigCat. ConfigCat can be integrated and used in many languages and frameworks. With the 10 minutes trainable interface, you can your teammates can get up and running with feature flags quickly.
To keep up with other posts like this and announcements, follow ConfigCat on Twitter, Facebook, LinkedIn, and GitHub.
