How to A/B test your Python application
Will showing the number of book copies sold on my website encourage more people to buy it? To answer this question confidently, I can rely upon A/B testing for guidance. This method of testing allows us to evaluate two versions of a website or app by releasing them to different user segments to see which one performs better.
To streamline and conduct a live A/B test experiment, I'll use ConfigCat's cloud-hosted feature flag management service to set up the user segments and toggle between the two variations using a feature flag. For context, ConfigCat is a developer-centric feature flag service with unlimited team size, awesome support, and a reasonable price tag.
Conducting a test experiment
I like to link each variation with its own "bucket". By using this analogy, we can group each variation more effectively for comparison in the future. During the test, as data is collected from each variation, it can easily be divided and placed into its respective bucket.
The first bucket is called the control bucket - it represents the state of the application without the new improvements or updates and can be considered a benchmark when making later comparisons. The second bucket is called the variation bucket and includes the new features or improvements to be tested. With that in mind, my goal in this experiment is to answer the following question:
Will showing the number of book copies sold lead more people to purchase the book?
Before conducting the test, we must first identify each bucket. For this, I've created a sample app to help us along the way. Here's a screenshot of it:
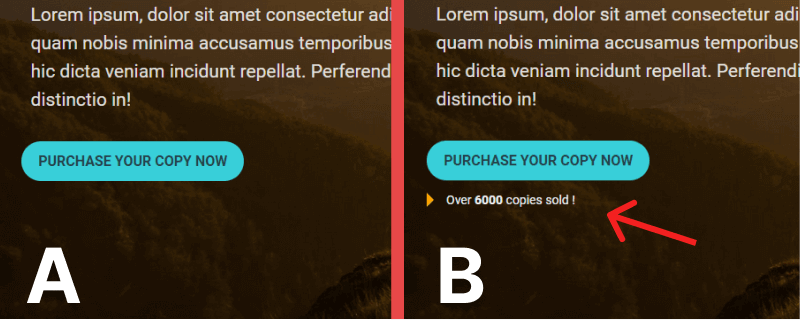
The variation bucket is labeled B (the one I want to test), and the control bucket is labeled A. Let's say that the control bucket is currently influencing an average of 200 book purchases from 15% of my users per week. My next task is to release the variation bucket to another 15% of users to collect metrics. To do this, I'll need to set up a feature flag and configure a user segment.
Using feature flags in A/B testing
Feature flags are a piece of code that conditionally hides and displays functionality. In order to switch between the two buckets while the app is running we can link the new component/feature to a feature flag. When the feature flag is on, the message will be displayed, and when it's off, it will be hidden. Using a feature flag has the added benefit of allowing you to specify a subset of users to display the new feature to. This is what we need to configure to gather metrics for variation B.
Here's a short overview of how to do this:
Creating a feature flag
1. Sign up for a free ConfigCat account
2. In the dashboard, create a feature flag with the following details:
Name: canShowCopiesSold
Key: canshowcopiessold
Description: Showing the number of book copies sold
Make sure to turn on the feature flag in your environment.
3. Click the ADD FEATURE FLAG button to create and save the feature flag
4. To create a user segment for testing, click the TARGET % OF USERS button and configure a fixed percentage (15%) as shown below:

With this set, when the feature flag is turned on in the following step, the variation bucket will only be available to 15% of the user base.
5. Integrate the feature flag into your Python application
To track and collect the click events for the variation bucket, I'll be using a product analytics tool called Amplitude. In the end, I'll show you how to compare the clicks to that of the control bucket.
Setting up Amplitude
1. Sign up for a free Amplitude account
2. Switch to the Data section by clicking the dropdown at the top left
3. Click the Sources link under Connections in the left sidebar, then click the + Add Source button on the top right
4. Select the Python SDK from the SDK sources list and enter the following details to create a source:

5. You should be automatically redirected to the implementation page. We'll get back to this soon, but first, let's add an event:
Adding an event
By creating an event, we are instructing Amplitude to specifically listen for that event and collect it. Later, our code will trigger this event whenever the purchase button is clicked.
1. Click the Events link in the left sidebar under Tracking Plan to access the events page
2. Click the + Add Event button at the top right to create an event and fill in the following details:
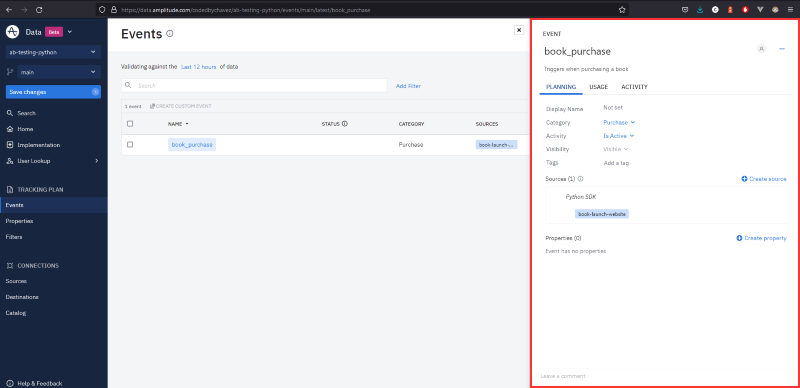
In the above, I created an event with the name book_purchase to represent the type of event I plan to trigger and send later on. A category was then added. The event was then activated by selecting the is Active option. Lastly, I added the correct source to this event.
3. Click the Save changes button in the left sidebar
Integrating with Amplitude
Click the implementation link in the left sidebar to see the integration instructions page.
1. Install the Amplitude CLI with the following command:
npm install -g @amplitude/ampli
2. Install the Amplitude Python SDK dependencies:
pip install amplitude-analytics
3. Run the following command to pull the SDK into Python:
ampli pull
In the above command, Amplitude will create the file ampli/ampli.py and download all the required settings from the previous steps into it. I'll import and use this file in the next section.
Sending an event from Python
Let's look at how we can trigger and send the event we created from Python.
1. Import and initialize Amplitude:
from .ampli import *

ampli.load(LoadOptions(
  environment=Environment.PRODUCTION
))
2. I'll change the purchase button type to submit then move it into a form. In this way, when it is clicked, a post request will be sent to my view, which will be used in the next step to send the event to Amplitude:
<form method="post">
  <button type="submit" class="purchase-button">Purchase Your Copy Now</button>
</form>
3. Below I've added an if statement to check for a POST method, which will then trigger and send the book_purchase event to Amplitude:
# ...

configcat_client = configcatclient.create_client('YOUR_CONFIGCAT_SDK_KEY')

@app.route("/", methods=('GET', 'POST'))
def index():
    # ...

    if request.method == 'POST':
      # Replace user_id with an actual unique identifier for your user
      ampli.book_purchase(user_id='[email protected]')

    # ...
See the complete code here.
Let's check for logged requests to verify that Python is connected to my Amplitude account.
Checking for logged requests
1. Under Connections in the left sidebar, click on Sources
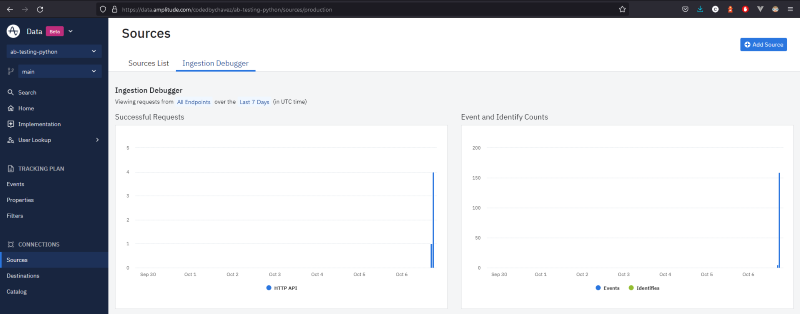
2. Clicking on the purchase button will log the event to Amplitude as shown in the Successful Requests graph on the left:
Setting up an analysis chart
1. Switch to the Analytics dashboard, by clicking the dropdown arrow on the top left next to Data
2. In the analytics dashboard, click the New button in the left sidebar
3. Click on Analysis and then Segmentation. Segmentation is a mechanism used by Amplitude to collect and create charts from user-initiated events. This way, Amplitude will create and set up a chart to collect data from the event we had previously created.
4. Select the event as shown below:
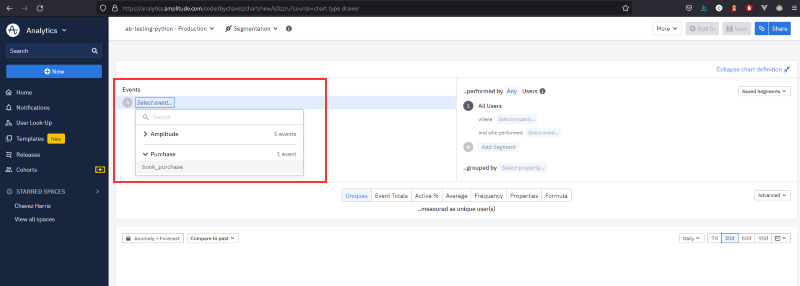
5. Click Save on the top right to save the chart
Analyze the test results
To compare and analyze the results between the two buckets, you can click the Compare to past dropdown at the top of the chart as shown below. Start by selecting the appropriate time interval. For example, since variation A (the control bucket) influenced 846 purchase clicks for the past week, I can compare that to the current week to determine if variation B (the variation bucket) is performing better. If it is, I can choose to deploy it to everyone.
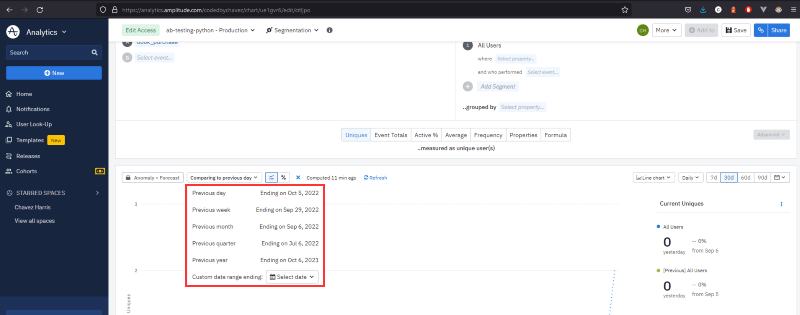
To keep a log of when you enabled and disabled your feature flags during testing you can add it to your charts on Amplitude.
Summary
Let's take a moment to recap what we did so far:
1. We discussed the concepts of the control and variation states (buckets) and identified them in the sample app
2. Created a feature flag
3. Set up an Amplitude account
4. Created a source
5. Added an event
6. Pulled the Amplitude configs and integrated them into Python
7. Sent and tracked a few successful requests
8. Created an analysis chart to record the click events
9. Finally, we looked at how we can compare the variation state to the control state in Amplitude's analysis chart by using the Compare to past option
Final thoughts
A/B testing is a useful method to determine if a new feature is performing to your expectations by testing it on a small percentage of users before deploying it to everyone. With the help of ConfigCat, you can streamline your test using feature flags and user segmentation. Their 10-minute trainable feature flag management interface makes it easy for you and your team to get up and running quickly. I highly recommend you give them a try by signing up for a free account.
To see more awesome posts like these and other announcements, follow ConfigCat on Twitter, Facebook, LinkedIn, and GitHub.
