How to Send Feature Flag Change Notifications to DataDog
Thanks to the latest CI/CD tools and services, software companies can now deliver multiple releases in a week. Over the release process, it's expected that DevOps professionals keep their eyes on the monitoring dashboard and roll-back the deployment on the first suspicion. Since the use of feature flags gets more and more traction, it seems like a good idea to connect those releases and the monitoring tools.
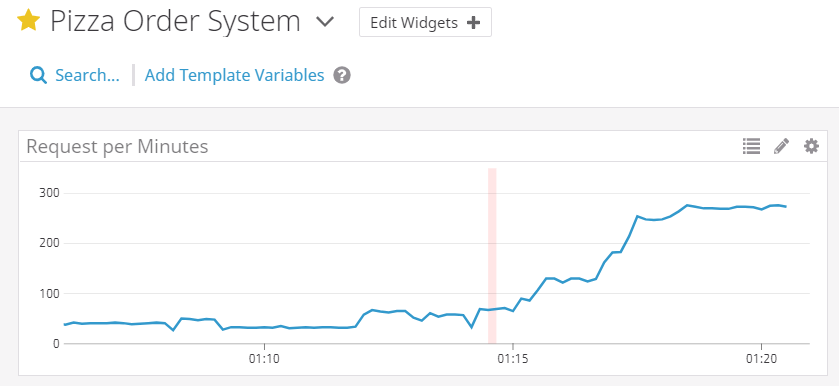
Why do we want to visualize a feature flag change in DataDog?
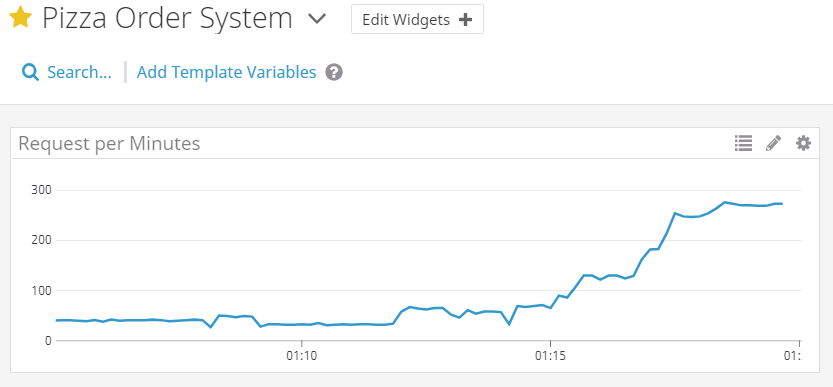
What happened around 01:15? Is it a glimpse of a ramp-up? Should we do something about it? Scale-out/up or is this a bug?
We want to know if someone released something to production. In case of feature flags, we want to know if someone flipped the switch.
How to connect ConfigCat to DataDog
Our goal here is to mark the point in time on our DataDog graphs when a feature flag value has been changed in our production environment.
We will use ConfigCat's DataDog Integration. It sends the feature flag changes as Events to DataDog. You can find a detailed guide on how to set it up here.
An event will look something like this:
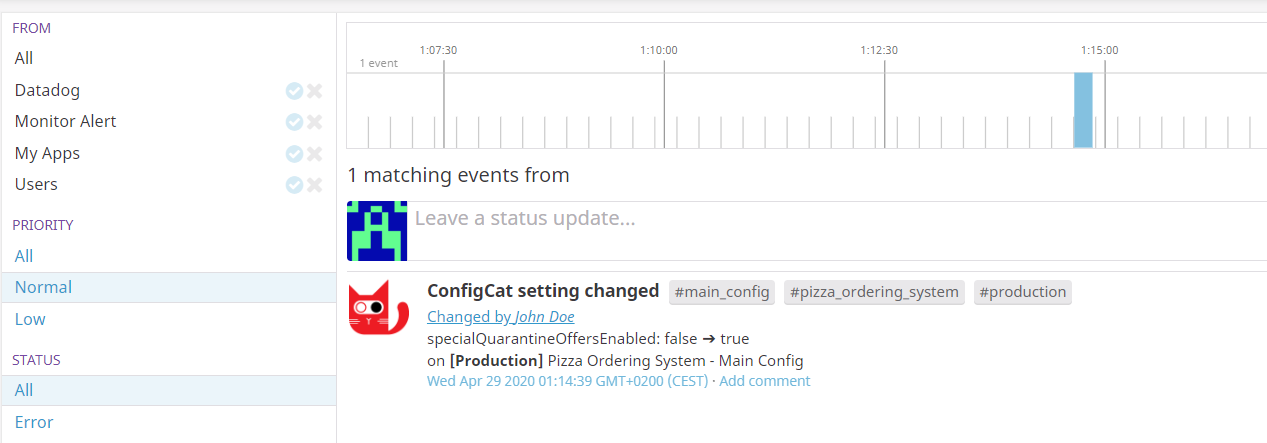
Every event is tagged with ConfigCat Product Name, ConfigCat Config Name, and ConfigCat Environment Name. The source of the event will be configcat. Tags help you to group your monitoring events and alerts.
How to set alerts on feature flag changes in DataDog
Once the event is in DataDog, you can set up Alerts to notify the related channels about feature flag changes.
Here is a quick sample on how to set up a notification to @devops if the events count is above 1 in the last 5 minutes:
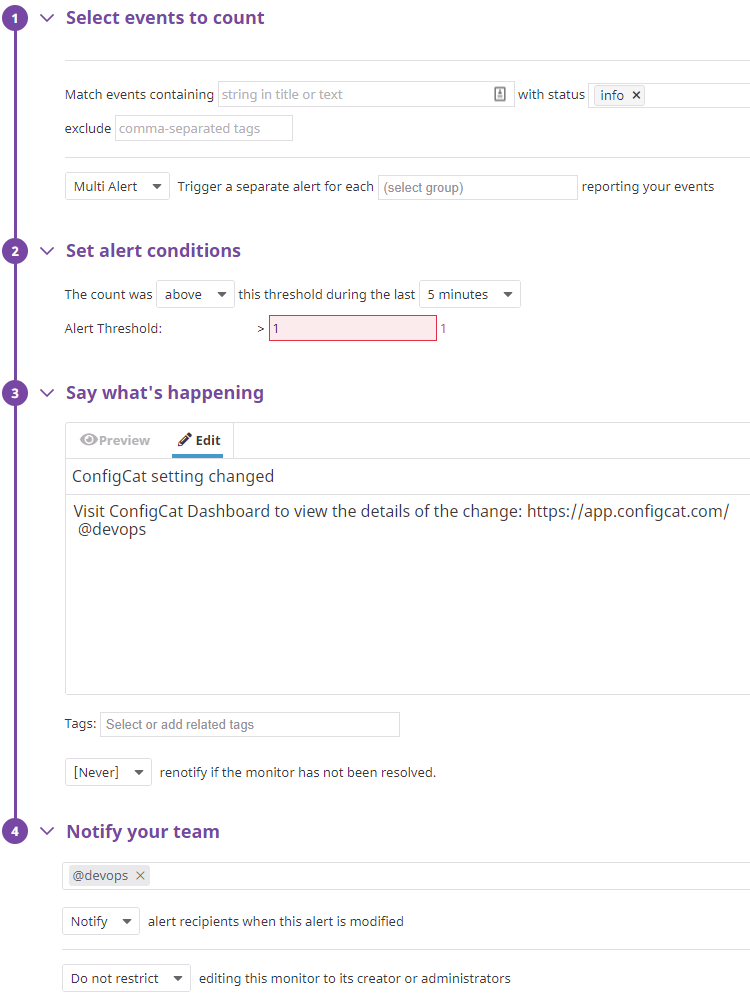
How to create a time-series diagram on feature flag changes in DataDog
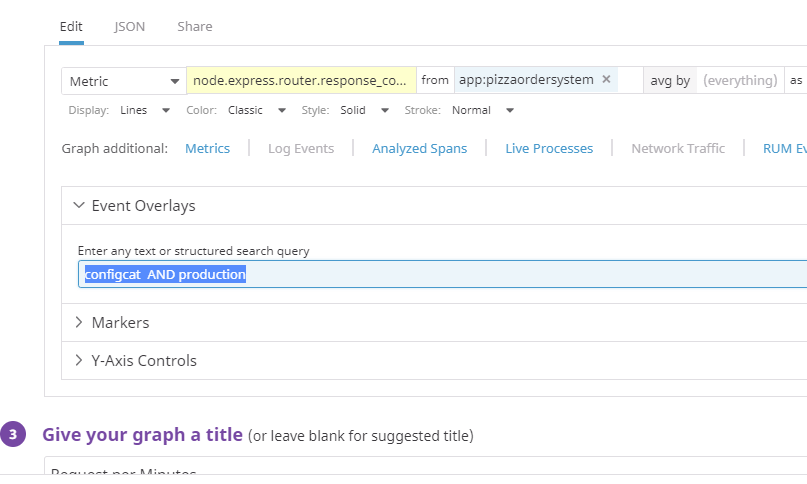
This solution will not send any notifications but a Time-series diagram. The Time-series widget can add more context to your Event-Overlay graph.
I added the following search query to my previous Time-series widget to filter events from configcat and it happened in my production environment.
The red mark shows that a feature has been turned on.

You can improve your release monitoring dashboard and alerting system in a few minutes. It's pretty nice, isn't it? :)
Related articles and links
If you're interested in DevOps automation, take a look at what our friends at Bunnyshell are building.
